
For those who have been looking at the price of gold via the daily chart, things perhaps have been a lot more promising for the bulls bar the last few days.
Since hitting a 5-year low of about $1,080, the price of gold rallied to hit a two month high of about $1,190 thereby triggering optimism among gold investors that the yellow metal could carry on to break the $1,200 mark again for the third time this year.
However, that wasn’t to be and the price of the yellow metal has since plunged to trade at about $1,106 per ounce thanks to Fed’s recent damaging news on the yellow metal.
(Click on image to enlarge)
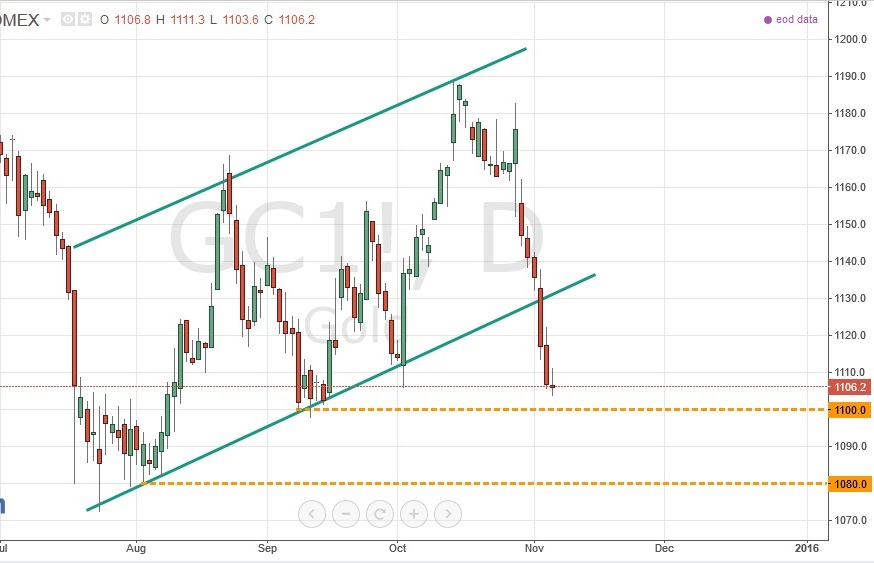
Fig 1: Gold price chart, daily analysis
The price of the yellow metal has broken downwards through the current upward trending wedge which seemed set to trigger a rebound at about $1,130. Therefore, investors now have new targets, and these do not seem to resonate well with the bulls.
Currently, the price of gold seems set to touch the $1,100 mark within the next few days, while the $1,080 level now appears to be a realistic target for the next few weeks. The price of gold is currently under pressure from the strengthening USD, while the promise of a US interest rate hike does not do it any favors.
Recent events as per Investix’s latest news about Gold indicate that we could be in for a continuous decline in the price of gold, and this spells doom and gloom for gold bulls. The downward trend can be confirmed by analyzing the weekly chart, as illustrated in the figure below.
(Click on image to enlarge)
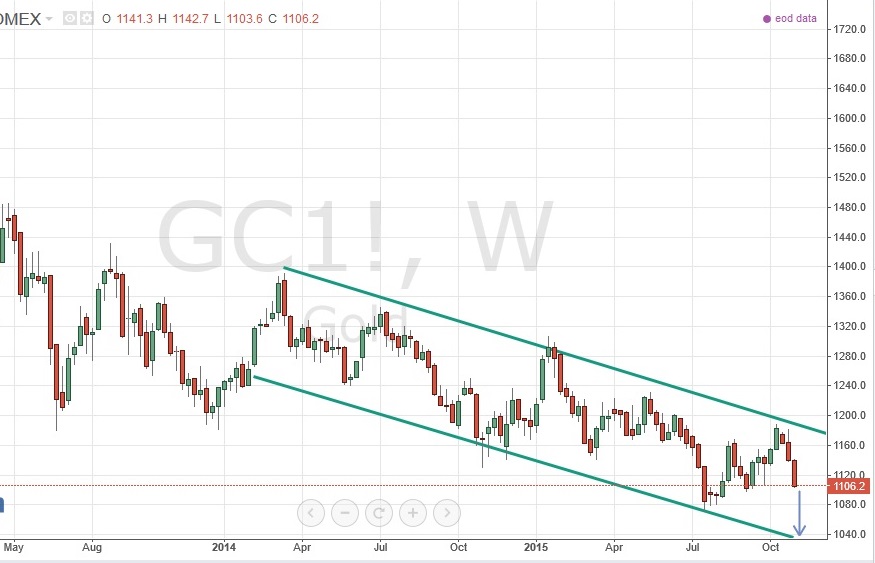
Fig 2: Gold price chart, weekly analysis
Based on the weekly chart, the next support level appears at $1,080, but when you look at the downward trending wedge, we could as well be headed for $1,040 per ounce in the next few weeks.
Based on what happens in the next couple of weeks with regard to US interest rate hike, the price of gold could fall to about $1,040 per once before the end of the month.
I have come across price predictions suggesting that the price of gold could fall below $1,000 for the first time in 7 years, but this could take some time to happen. However, the $1,000 level is not far off given that $1,040 already looks like a realistic target within the next 3-4 weeks.
Nonetheless, when we try to relate the behavior of the price of gold to US leading stock indices and ETFs, it is pretty clear that by the end of Q1 next year the price of the yellow metal could be well below $1,000 level.
(Click on image to enlarge)
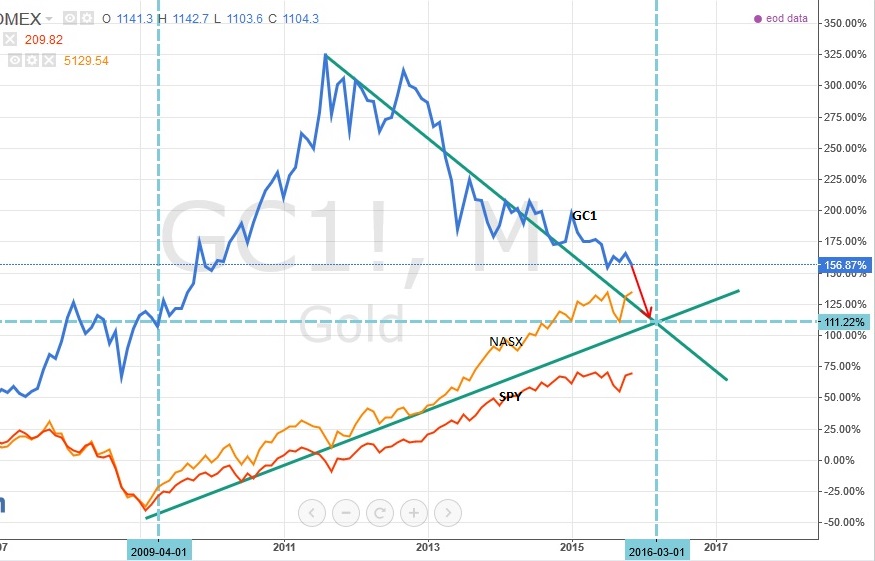
Fig 3: Gold price performance vs SPY and NASX
The price of gold characteristically rallies when economies are not doing well as investors move to cushion capital gain losses by investing in the yellow metal. In addition, countries also tend to buy more gold bullion in a bid to improving their balance of payments and securing their currency against adverse economic conditions.
This is why the price of Gold rallied so much between 2009 and 2011 as economies looked to recover from the 2008/2009 financial crises. However, since 2013, most economies and especially the US economy have shown great improvement and this has triggered increased interest in equities thereby lowering demand for gold investments.
Based on the two projectile lines relating gold price performance to US SPDR S&P 500 ETF (NYSEARCA: SPY) and NASDAQ Composite (NASDAQ:COMP) performances, the intersection point seems set for early March 2016, upon which the price of gold will be trading at the same levels witnessed in 2009.
(Click on image to enlarge)
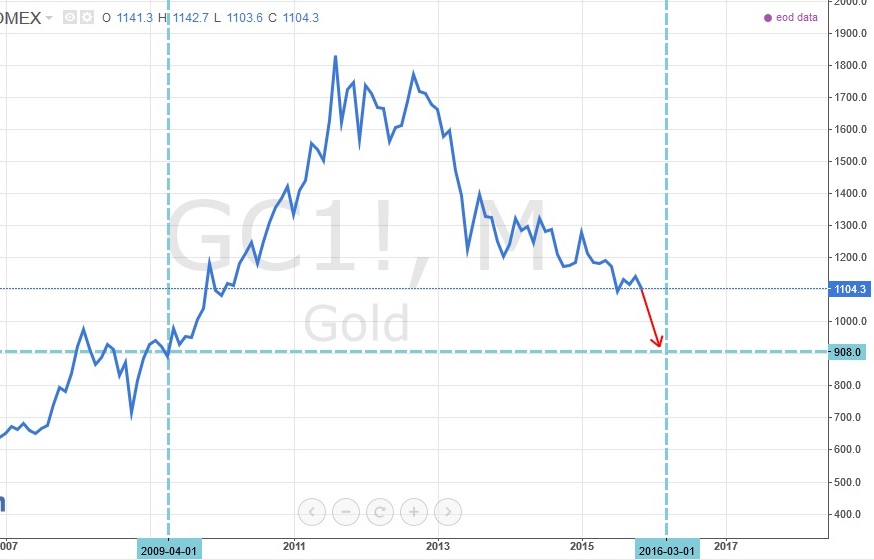
Fig 4: Gold price down to $900 by March?
When I first came across predictions suggesting that the price of gold could fall below $1,000 by early next year I couldn’t believe it given how long the price of the yellow metal has been able to trade above $1,100, let alone $1,000.
However, this analysis now confirms that indeed, we could see the price of the yellow metal drop below $1,000 for the first time in 7 years, as early as March next year.
Conclusion
The bottom line is that the price of Gold is going to rely a lot on what happens to the US interest rates by the end of the year. The US Fed indicated that any increment would be gradual, which means bit by bit uptick yearly, semi-annually or quarterly.
It is pretty obvious that a majority of the initial uptick has already been priced in the price of gold, and that only a marginal dip should be expected should the Fed increase rate by the end of the year, as widely expected.
However, is there are any indications that a further uptick could be on the way by Q1, or H1 2016, then there is a huge possibility that the price of gold could fall further below $1,000 and towards $900 early next year.


Comments
Log in or sign up to join the conversation.