

Hello everyone. In today’s article, we will look at the past performance of the 4H Hour Elliott Wave chart of Invesco Nasdaq ETF ($QQQ). The rally from 10.13.2022 low unfolded as a 5 wave impulse. So, we expected the pullback to unfold in 7 swings and find buyers again. We will explain the structure & forecast below:
$QQQ 4H Elliott Wave Chart 10.26.2023:
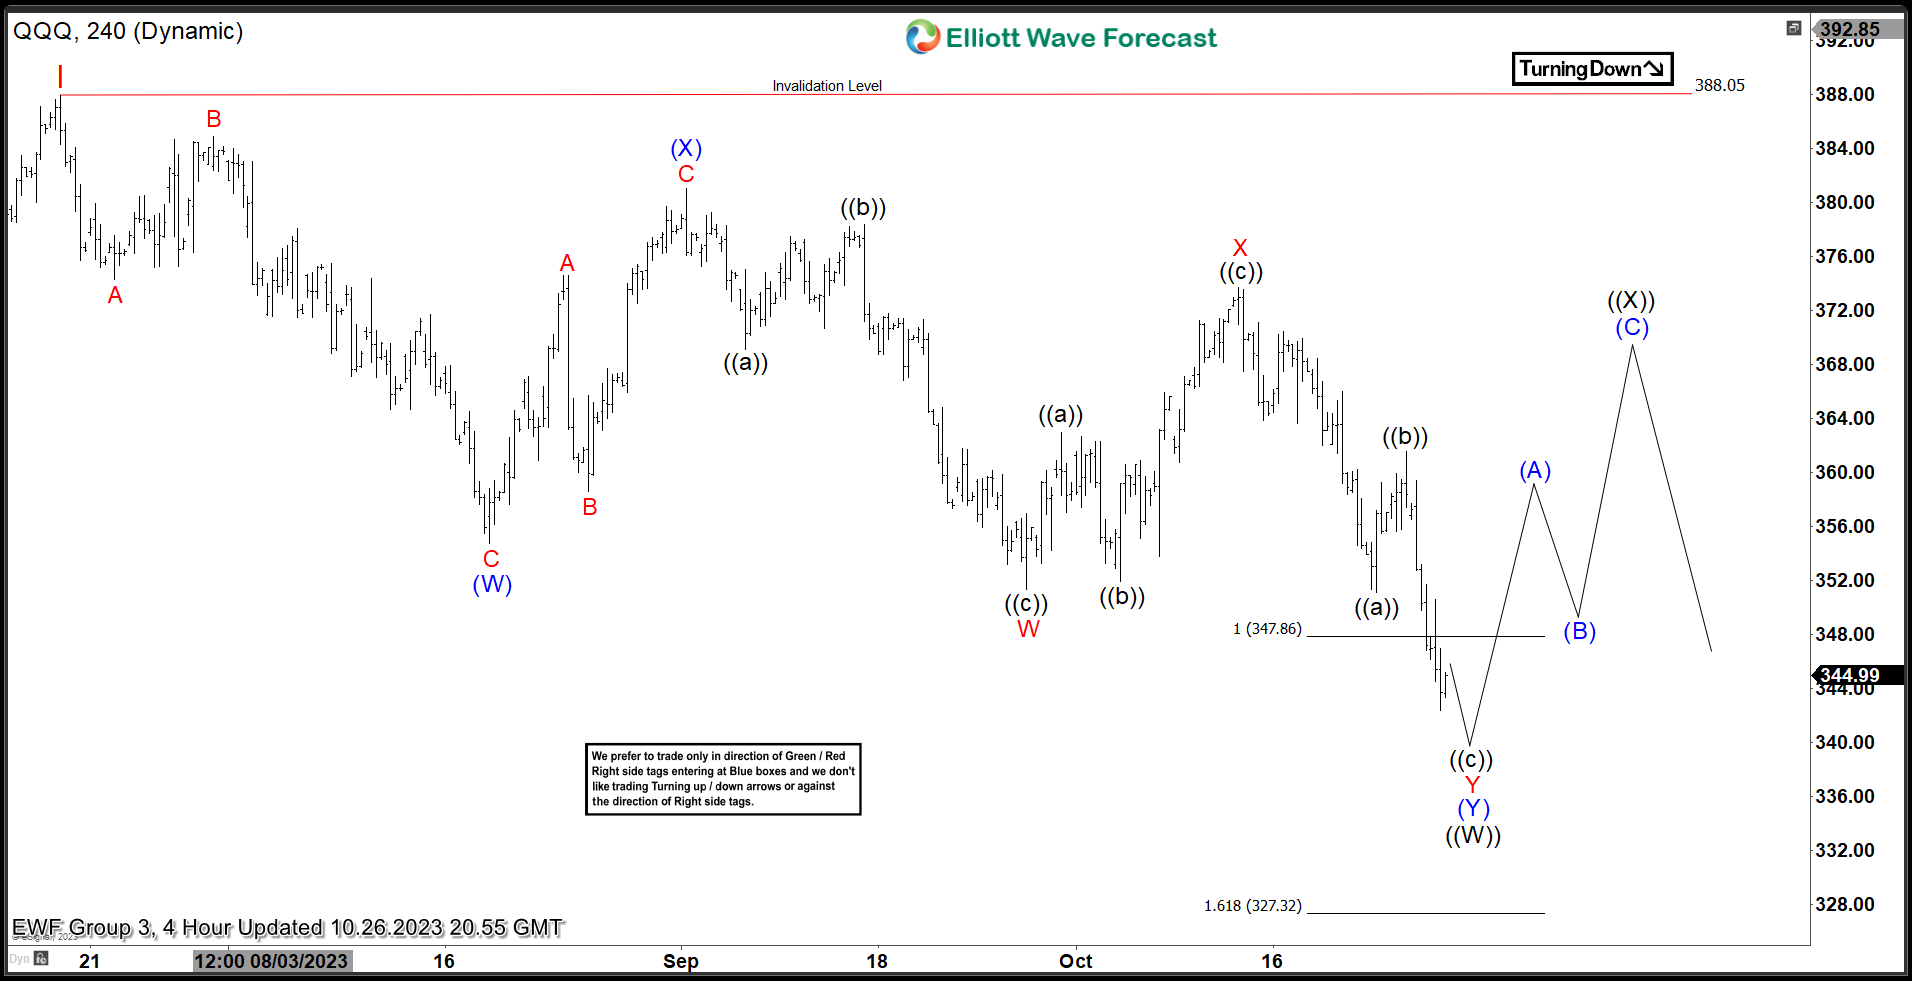
Here is the 4H Elliott Wave count from 10.26.2023. The rally from 10.13.2022 peaked at red I at $388.05 and started a pullback to correct it. We expected the pullback to find buyers at ((W)) in 7 swings at $347.86 – 327.32.
$QQQ 4H Elliott Wave Chart 11.02.2023:
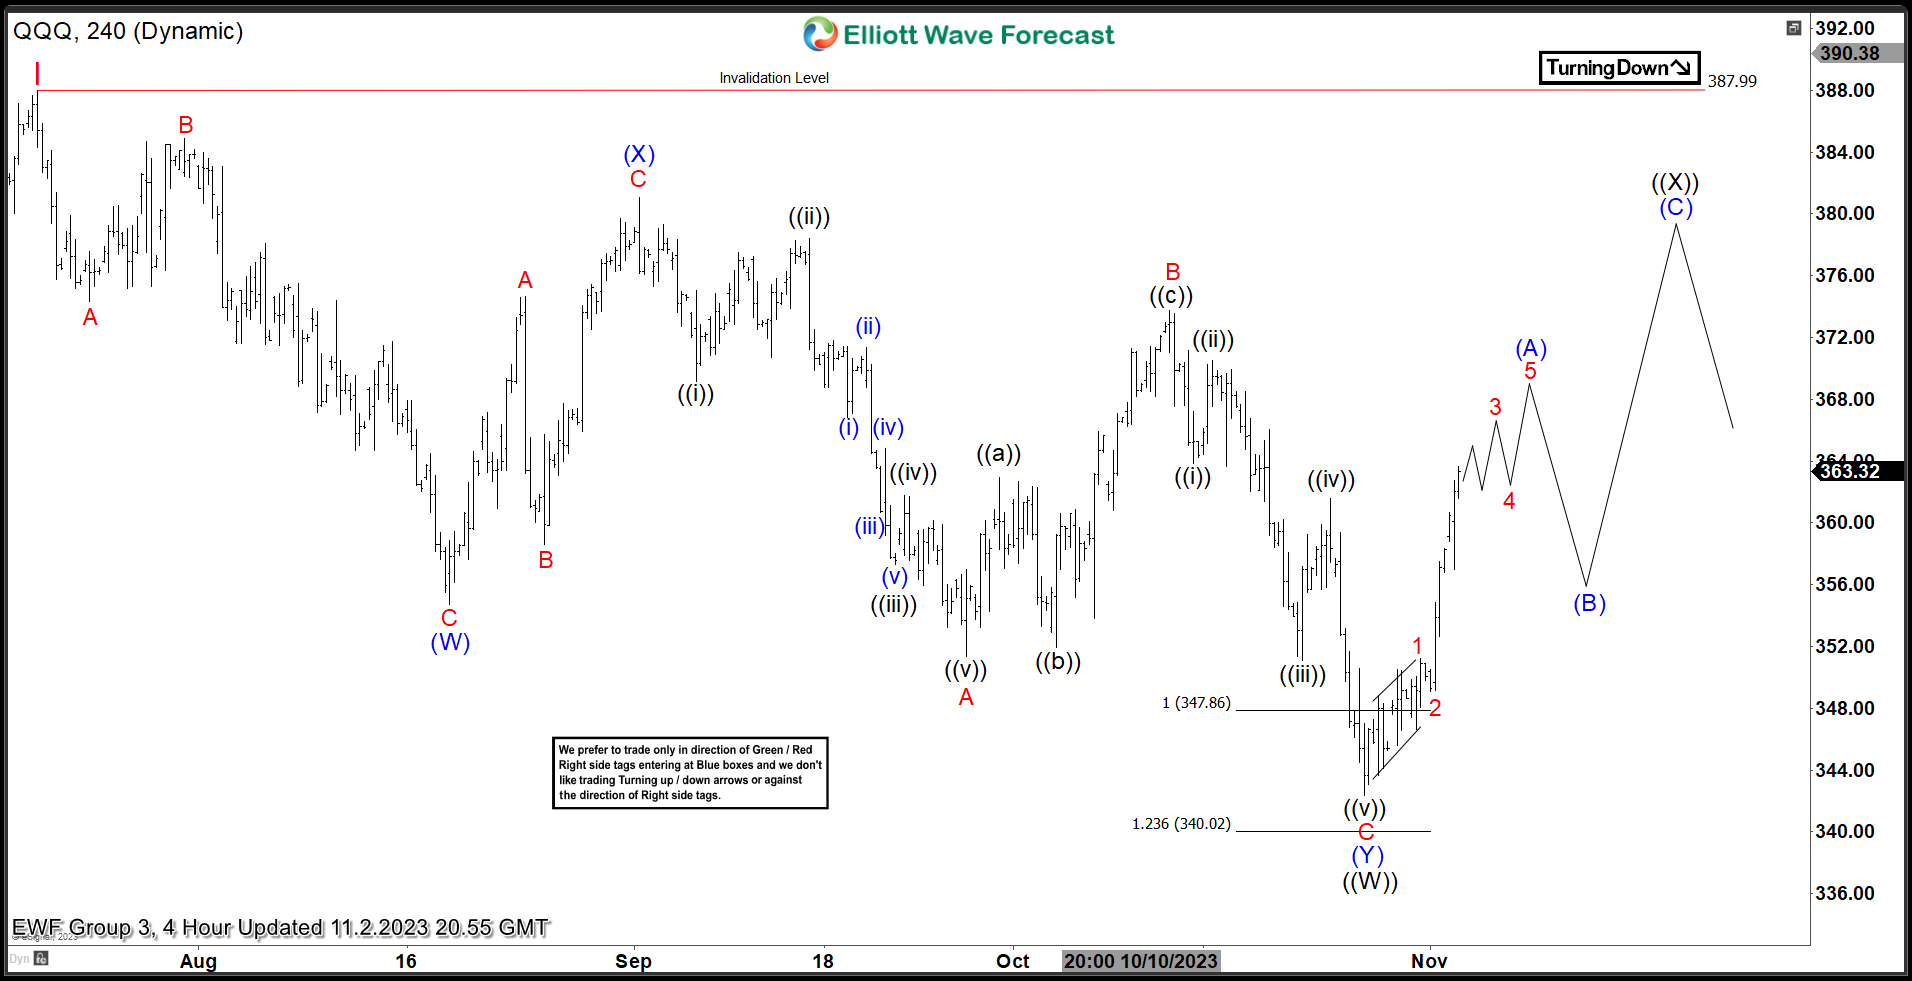
Here is the 4H update from 11.02.2023 showing the bounce taking place as expected. The ETF reacted higher after reaching the equal legs area allowing longs to get a risk free position. We expect the ETF to continue higher to correct July 2023 peak in 3 swings before resuming the downside.



Comments
Log in or sign up to join the conversation.