

Intel’s resurgence in the AI era is no longer a distant forecast—it’s unfolding in real time. After years of being overshadowed by GPU giants, Intel (INTC) has transitioned from underdog to frontrunner, leveraging its Starlink‑scale infrastructure, foundry partnerships, and Elliott Wave‑validated rally structure. With massive gains already seen in 2026 and a rally looking to extend to new all-time highs. Intel is not just participating in the AI revolution—it’s shaping it. This follow‑up builds on our earlier analysis of Intel’s “revenge” in the AI war, examining how its technical patterns and market dominance continue to align with long‑term bullish projections.
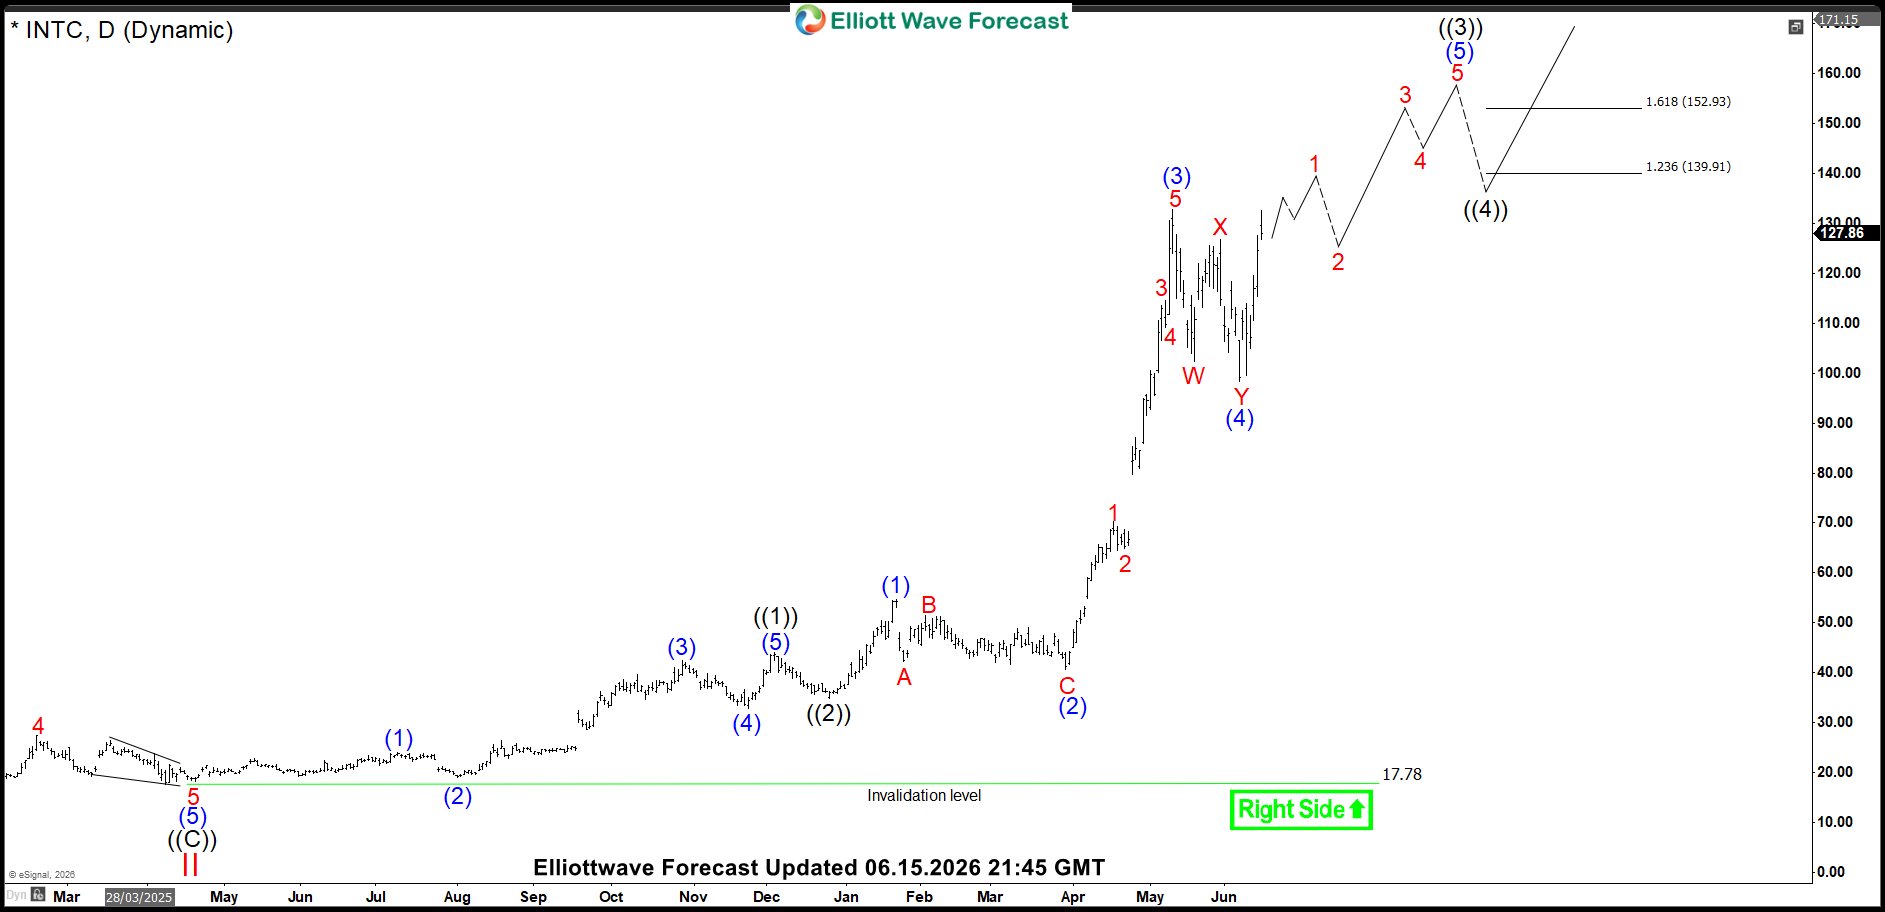
INTC Daily Chart Elliott Wave Analysis – 15 June 2026
In our previous article, we expected a pullback in stock price in wave (4) before resumption of the rally in wave (5). The chart below shows that wave (4) unfolded as a double three Elliott wave structure in which wave W ended at $102.40, wave X completed at $126.64, and wave Y ended at $98.33 to complete the wave (4) pullback. Stock price resumed the rally after this, and even though it has not made a new high above wave (3) yet, the impulsive structure of the rally suggests it will end up breaking higher. A break of the wave (3) peak at $132.75 will confirm that wave (5) higher is in progress. Until then, a larger double correction lower in wave (4) can’t be ruled out.
Targets for wave (5) range between $139.91 – $152.93, which is the inverse 123.6 – 161.8% Fibonacci extension area of wave (4) pull back. We are very close to the wave (3) peak, and an impulsive rally from the wave (4) low is about to complete, so we believe this would only complete wave 1 of (5), after which we could expect a pullback in wave 2 followed by extension higher in wave 3, 4 and 5 to complete wave (5). This should complete the cycle from the December 2025 low and result in another pullback in the form of wave ((4)) before continuation higher.


Comments
Log in or sign up to join the conversation.