
Yesterday, a discussion on Marketplace (w/Justin Ho) about how these terms fit together. In order to explain, consider a broad price index (e.g., CPI). Then one can illustrate these concepts graphically:
(Click on image to enlarge)
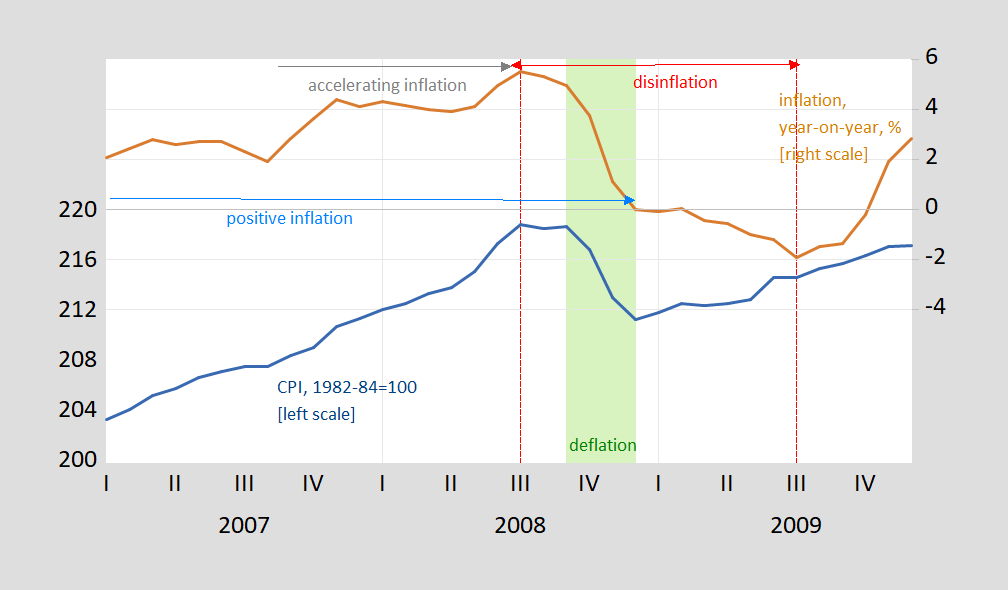
Figure 1: CPI, 1982-84=100 (blue, left scale), year-on-year inflation rate of CPI, % (brown, right scale). Green shading denotes deflation red arrow denotes disinflationary period, sky blue arrow denotes positive inflation, gray arrow denotes accelerating inflation period. Source: BLS and author’s calculations.
In particular, you can have disinflation with positive inflation, and you can have deflation with positive inflation. Obviously, there’s some judgment involved (do you use year-on-year or quarter-on-quarter inflation, or even month-on-month, and when you get to shorter horizons, do you call a one-month decline in inflation a “disinflation” or not).


Comments
Log in or sign up to join the conversation.