
Last Wednesday and Thursday delivered the first real losses for this rally since it started around three weeks ago, but Friday brought a nice 'full stop' to these losses - enough to offer buyers a relatively low risk/reward play for those seeking a trade.
The Nasdaq finished with a doji pattern, and potential bullish harami cross. The latter is weakened by the lack of oversold momentum (stochastics) indicator. However, the Nasdaq is enjoying some relative outperformance over the S&P 500.

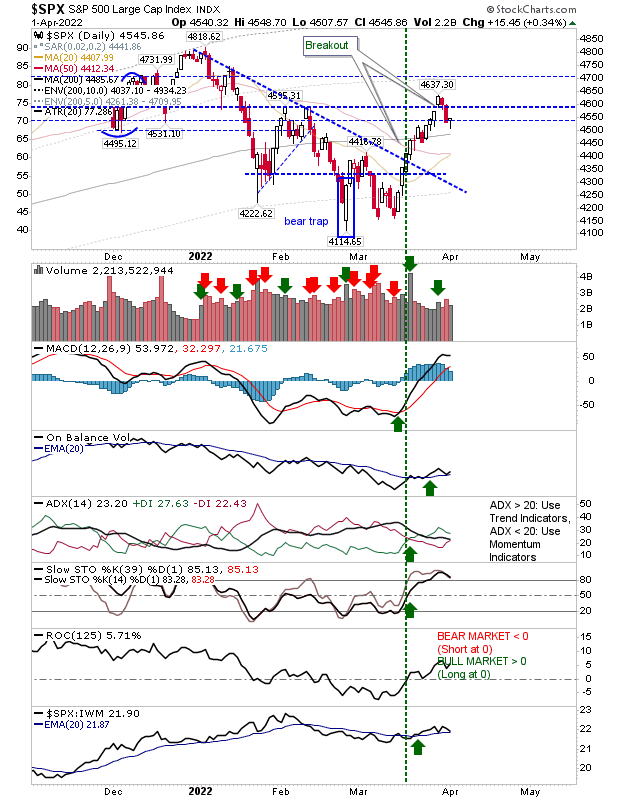
Meanwhile, the S&P 500 closed with a bullish harami pattern just above its 200-day MA and sufficiently near support of the February double-top, suggesting that it is finding demand there. Technicals are net positive and the index is a long way from February/March lows. As the Nasdaq was outerperforming the S&P 500, here we have the S&P outperforming the Russell 2000.
The Russell 2000 is nestled on breakout support, and it managed to recover most of Thursday's losses. It, too, enjoys net bullish technicals, but it is still underpeforming relative to peer indices - although it managed to make back some of these losses on Friday. The measured move target from February's high was negated on the breakout, so look for higher prices in the months ahead.

Last week's losses kickstarted a new swing high for the rally. The question is whether last week is a swing high, or if Friday's buying simply marked a pause in the rally. The truth probably lies somewhere in between - I suspect the reversal marked a zig-zag reversal, and we have got the 'zig,' but we have yet to see the 'zag.'


Comments
Log in or sign up to join the conversation.