

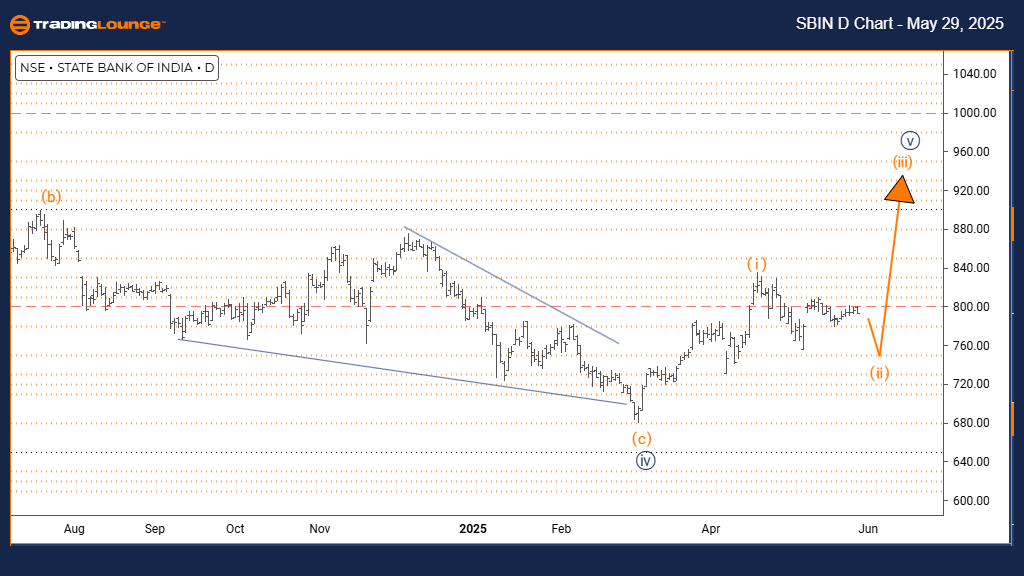
STATE BANK OF INDIA Elliott Wave Analysis – Trading Lounge Day Chart
STATE BANK OF INDIA Elliott Wave Technical Analysis
- Function: Counter Trend
- Mode: Corrective
- Structure: Orange Wave 2
- Position: Navy Blue Wave 5
- Direction (Next Higher Degree): Orange Wave 3
- Details: Orange Wave 1 appears complete; Orange Wave 2 is developing.
Technical Overview
The daily chart for State Bank of India shows a counter-trend corrective phase within its broader bearish structure. Orange Wave 2 is unfolding within Navy Blue Wave 5, suggesting a temporary retracement after the completion of Orange Wave 1.
Market Behavior
This corrective move reflects limited upside potential. The bounce forming Orange Wave 2 serves as a pause before the anticipated continuation of the downward trend in Orange Wave 3. The setup implies short-term volatility as the corrective wave plays out.
Trading Implications
Traders should monitor price action for signals of Orange Wave 2's completion, which would likely precede a stronger downward move in Wave 3. While a bounce is occurring, it fits within a larger bearish correction. Risk management remains critical in this counter-trend setup.
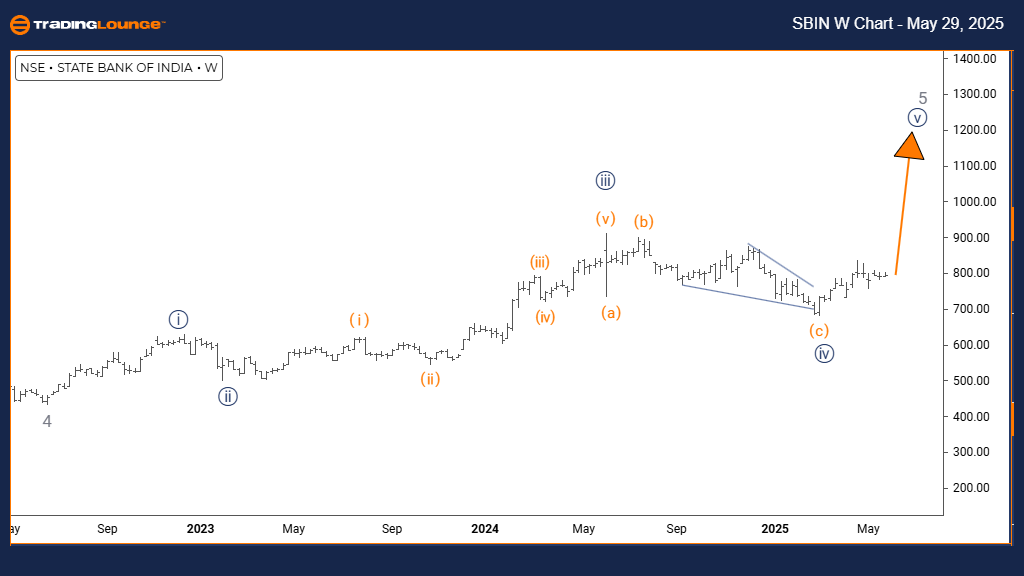
STATE BANK OF INDIA Elliott Wave Analysis – Trading Lounge Weekly Chart
STATE BANK OF INDIA Elliott Wave Technical Analysis
- Function: Trend
- Mode: Impulsive
- Structure: Navy Blue Wave 5
- Position: Gray Wave 5
- Direction (Next Higher Degree): Navy Blue Wave 5 (in progress)
- Details: Navy Blue Wave 4 appears complete; Navy Blue Wave 5 is in motion.
Technical Overview
The weekly chart shows State Bank of India entering the final phase of its bullish cycle. The wave count places the stock in Navy Blue Wave 5, part of the larger Gray Wave 5. With Navy Blue Wave 4 completed, this current wave represents the last impulsive leg.
Market Behavior
The impulsive nature indicates continued buying pressure. However, traders should watch for signs of exhaustion as the fifth wave nears maturity. This configuration signals strong, yet potentially concluding, upside momentum in the broader trend.
Trading Implications
One more upward push may finalize this five-wave sequence before a significant correction or reversal occurs. Key signs like momentum divergence or slowing upward pace should be closely monitored. The weekly perspective underlines cautious trading and effective position management at this late stage.
Technical Analyst: Malik Awais
More By This Author:
Elliott Wave Technical Analysis: Ripple Crypto Price News For Thursday, May 29
Unlocking ASX Trading Success: Cochlear Limited - Wednesday, May 28
Elliott Wave Technical Analysis: Caterpillar Inc. - Wednesday, May 28



Comments
Log in or sign up to join the conversation.