

The Indian Rupee (INR) edges up against the US Dollar (USD) on Tuesday. The USD/INR ticks lower to near 95.67 after refreshing the three-week high at 95.85 in the opening session. The Indian currency has gained slight strength due to potential Reserve Bank of India’s (RBI) intervention.
According to a Reuters report, the RBI likely intervened in the foreign exchange market for an eighth consecutive session on Tuesday, four traders told Reuters, as elevated oil prices kept up pressure on the South Asian currency. Traders also said that state-run banks were spotted offering dollars, most likely on behalf of the RBI.
Oil prices rally as US-Iran ceasefire expires
In the early session on Tuesday, the MCX Crude Oil contract expiring on August 19 trades 1.1% higher to near Rs. 8,150, the highest level seen in two weeks.
Currencies from economies, such as India, which rely heavily on oil imports to meet their energy needs, tend to underperform in a high-oil-price environment.
Energy prices have rallied further as United States (US) President Donald Trump said on Monday that he is not interested in renewing the expiring agreement with Iran, according to a Bloomberg report. This has prompted fears that Iran and the US could restart military attacks against each other, a scenario that could escalate concerns regarding a prolonged energy supply disruption. Trump added that the US still has leverage over Iran, citing the US naval blockade on Iranian seaports.
US FOMC minutes awaited
Financial markets keenly await the release of the Federal Open Market Committee (FOMC) minutes of the July policy meeting on Wednesday to get fresh cues regarding the US inflation and the economic outlook.
Hints regarding the US interest rate outlook are unlikely as Fed Chairman Kevin Warsh remained committed to “no forward-guidance” on policy rates.
According to the CME FedWatch tool, traders have scaled back the possibility of a Fed interest rate hike at the September meeting.
USD/INR Technical Analysis
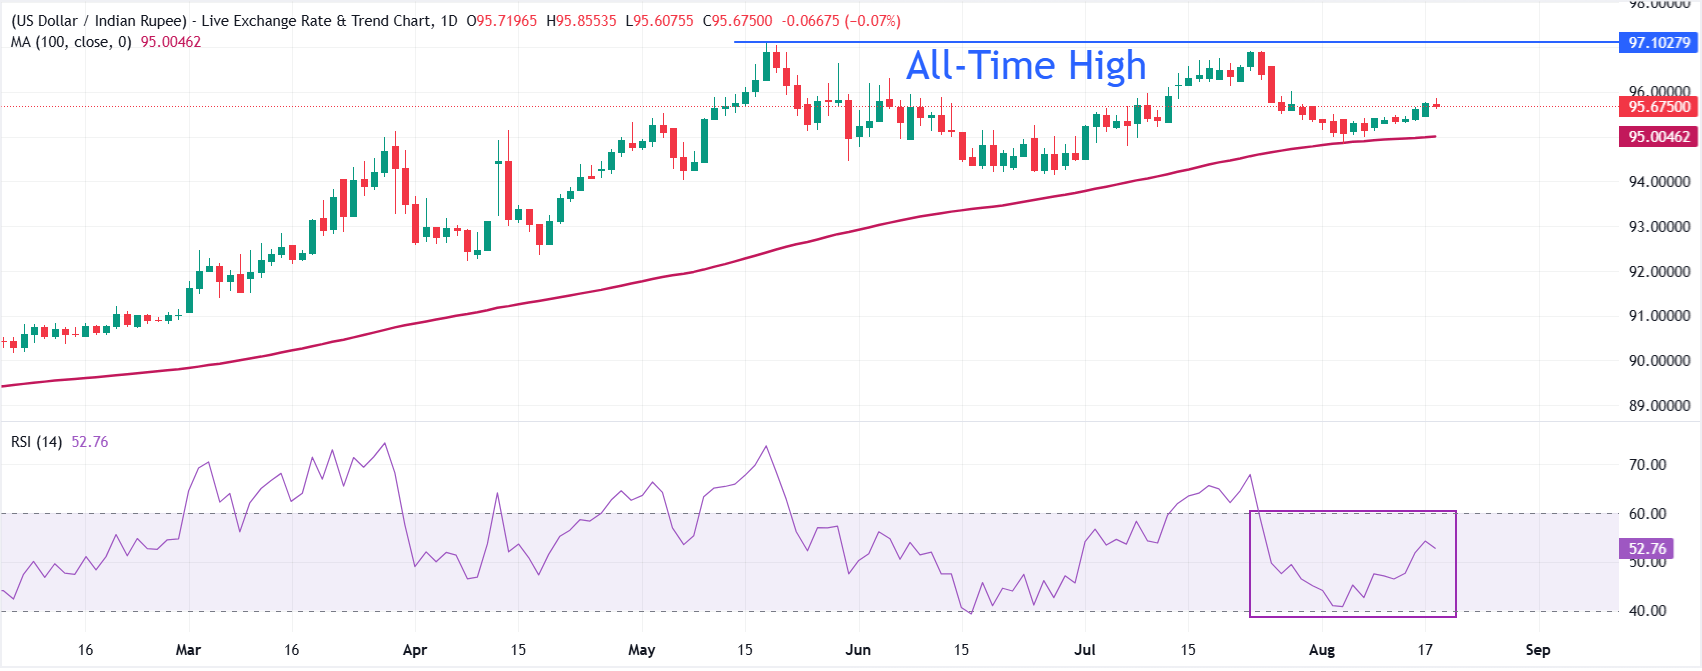
USD/INR trades at 95.67, holding above the 100-day simple moving average (SMA) at 95.0046, keeping the near-term bias moderately bullish as price consolidates near recent highs.
The Relative Strength Index (14) at 52.8 sits just above neutral, hinting at steady but not overstretched upside pressure.
On the downside, immediate support is seen at the 95.67 area, with stronger underlying demand emerging at the 100-day SMA around 95.00, which reinforces the broader upward structure. With no nearby technical resistance levels flagged by the current dataset, traders may watch how price behaves around these supports to gauge whether the pair can extend its grind higher or slip into a deeper corrective phase.


Comments
Log in or sign up to join the conversation.