


The charts of the major market indexes, on the whole, still allow for the prospect of a meaningful breakdown in the weeks and months ahead. It is far from a foregone conclusion, however, and there is one chart I find especially troubling. Let’s take a look.
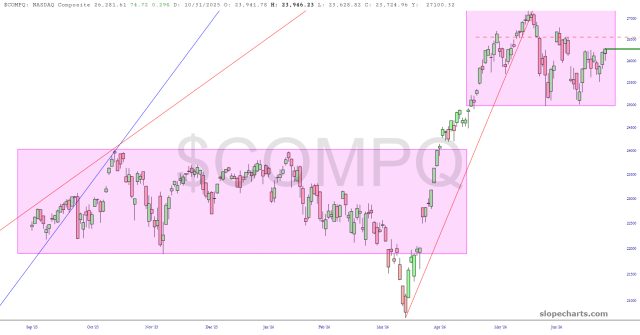
First up is the NASDAQ Composite, whose price needs to stay beneath the dashed red horizontal in order to remain viable for a move to the downside anytime soon. It will be a couple of weeks until tech earnings start to tumble in, so right now we’re at the mercy of Iran.
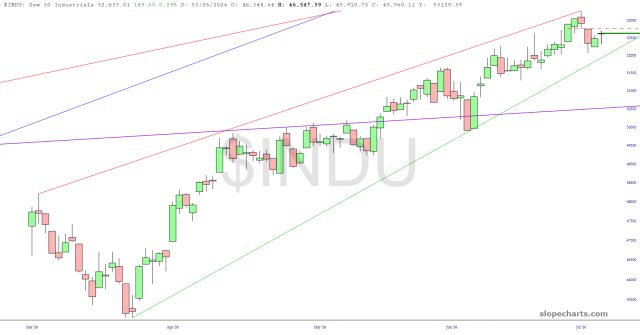
The Dow (DIA) is neatly within its wedge pattern, and it has still respected its price gap, yet it would take very little strength to push through it and render it moot.
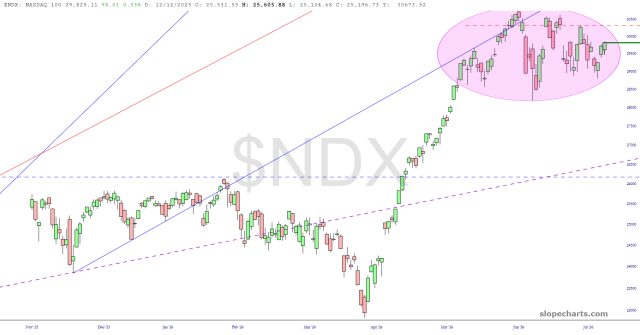
The NASDAQ 100 (QQQ) is still in a diamond configuration, but we need to break the Wednesday low for that to happen. It’s going to take something potent to do that, since even the resumption of war was met with little more than a shoulder shrug.
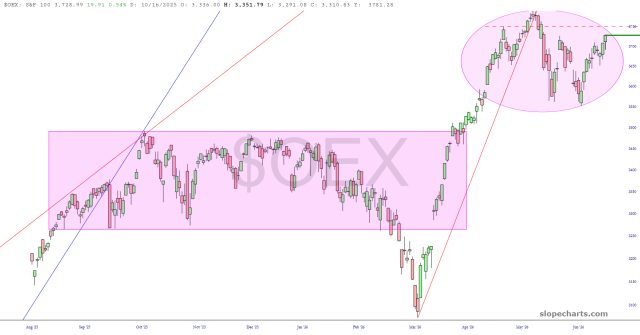
The S&P 100 (OEF) is showing more strength than tech, and even one strong day would push it above the diamond.
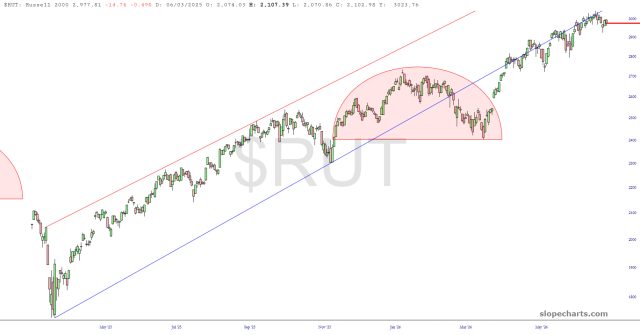
The Russell 2000 (IWM), which I am short by way of the IWM, has been grinding below its broken trendline for months.
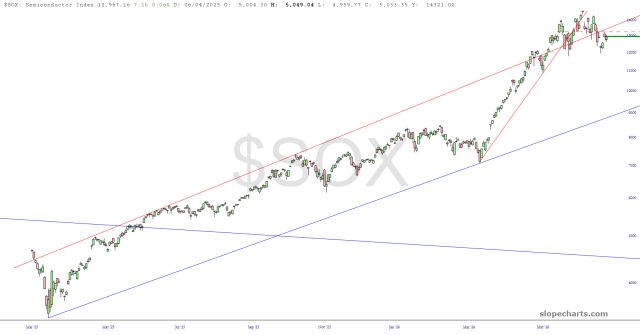
One of the more encouraging sectors continues to be semiconductors, which is where most of my shorts are concentrated. A few weeks ago, there seemed to be no stopping it, yet it has pushed back into its ascending price channel. A topping pattern might be forming, although it is only about 70% complete.
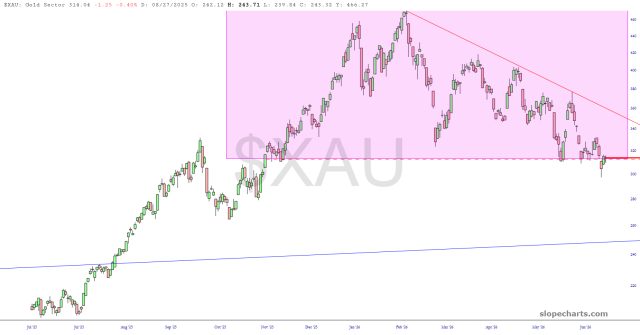
One of the most vulnerable patterns is the gold sector, which is sporting a very well-defined right triangle top. I think it’s very likely this will fall hard within two weeks.
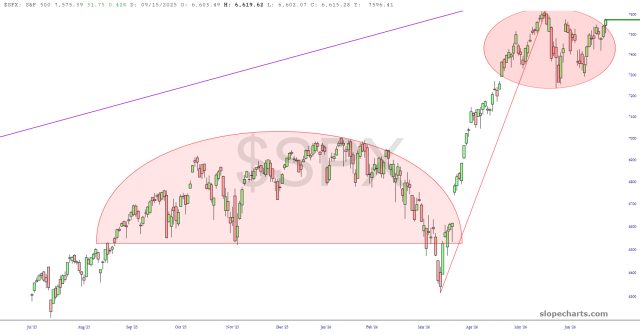
The last chart is the one which worries me the most: the S&P 500 (SPY). The strength we saw on Thursday and Friday may have morphed the diamond from a top to, instead, a continuation pattern. It would have to fall immediately, a substantially, early next week to reconstitute a bearish setup.



Comments
Log in or sign up to join the conversation.