


I wrote last month in my summary of that existing home sales report: “The housing market has reached a new, suboptimal equilibrium in sales, construction, prices, and inventory. Until some new positive or negative shock occurs (like a surprise new Fed hiking regimen), expect little change in this important leading sector of the economy, which is, needless to say, neutral for forecasting purposes.”
While existing home sales are much less important in terms of economic impact, they are about 90% of the market, and generally trend in accord with new home sales. And, like new home sales, they are very much downstream of mortgage rates, which have been in a range of 6% to 7% for almost all of the past four years:
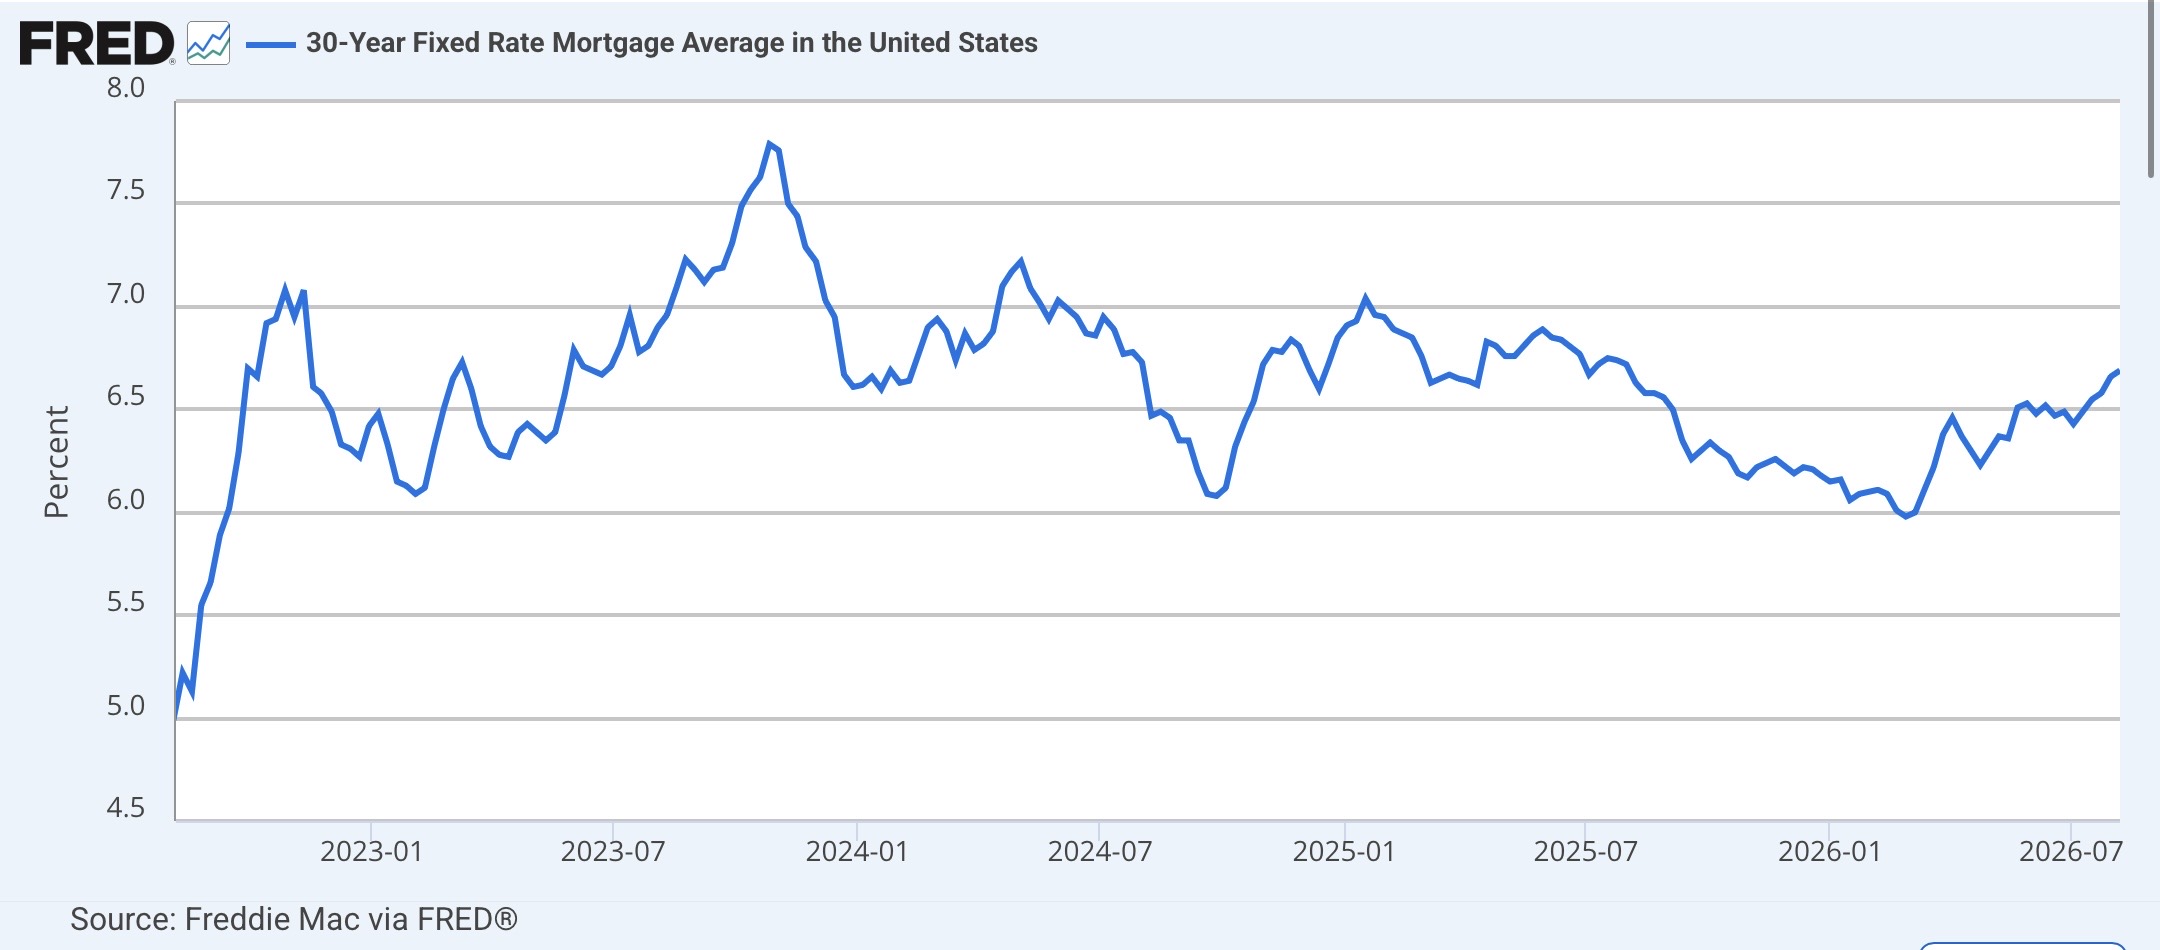
Although with the Iran war they have risen from 5.99% in February to 6.69% last week, they are still well within that range.
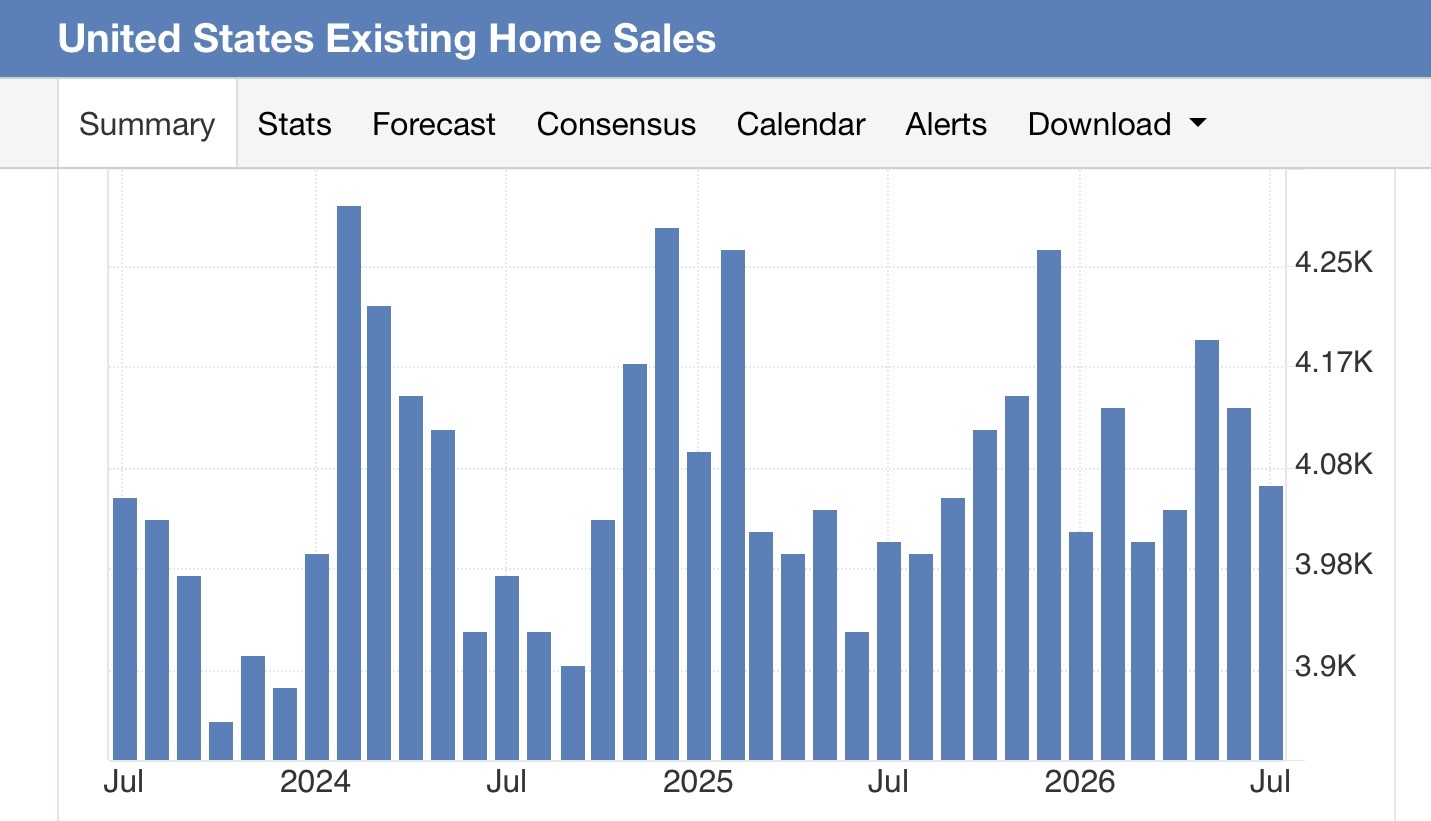
So, unsurprisingly, while existing home sales in July declined a seasonally adjusted -1.7% monthly to 4.06 million on an annualized basis, this is almost exactly in the middle of its range of between 3.85 - 4.30 annualized for the past three+ years:
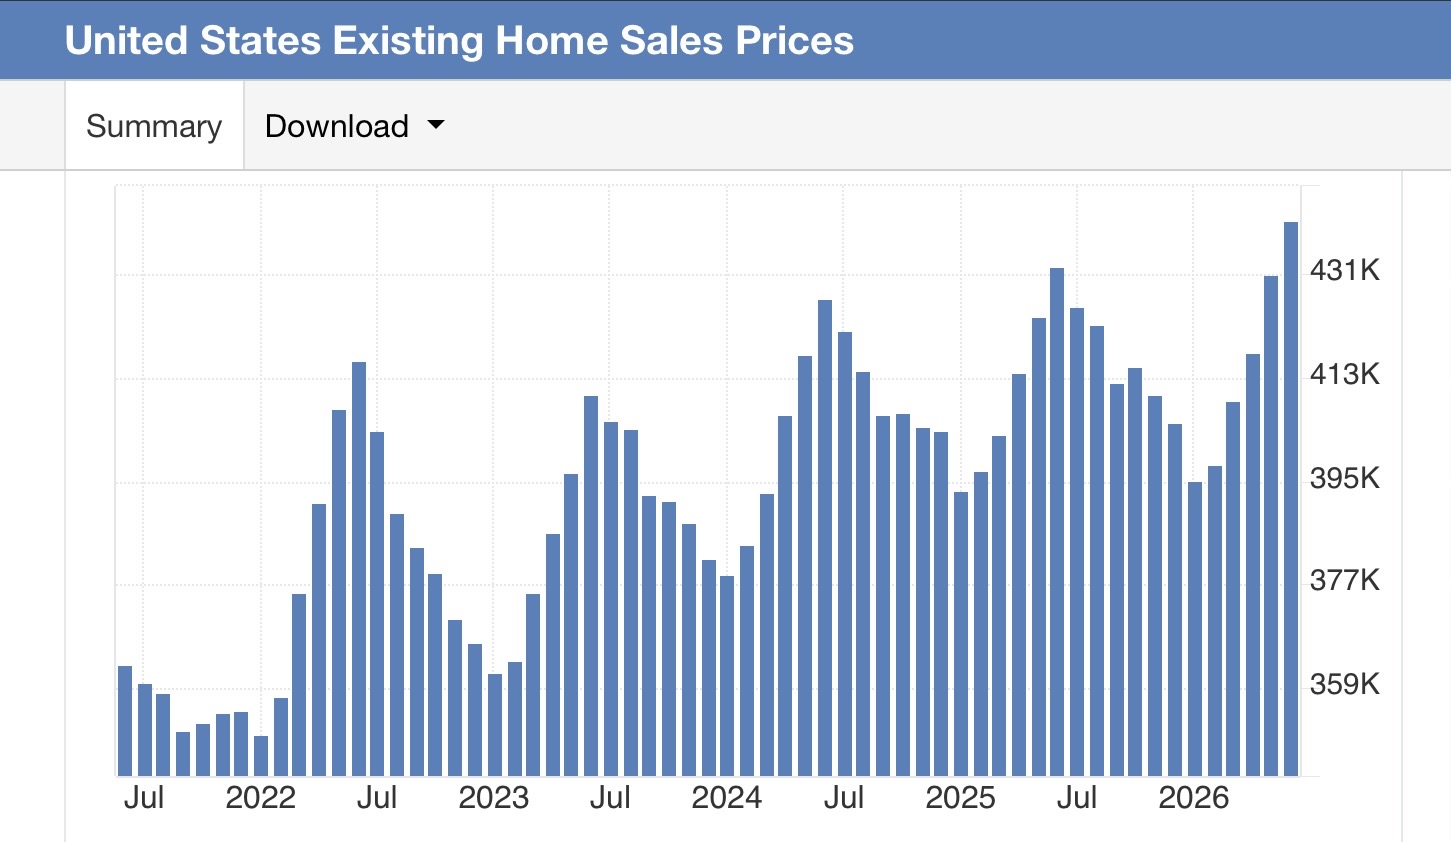
If sales follow mortgage rates, prices follow sales, and unsurprisingly with range-bound sales, prices on a YoY basis have been relatively calm as well. These are not seasonally adjusted, so we look at them YoY. And since February of last year, there has been no YoY comparison higher than 3.0%. In July, the YoY comparison was +2.0%. (For the record, on a monthly basis they declined -2.0%, but this is the typical seasonal pattern):
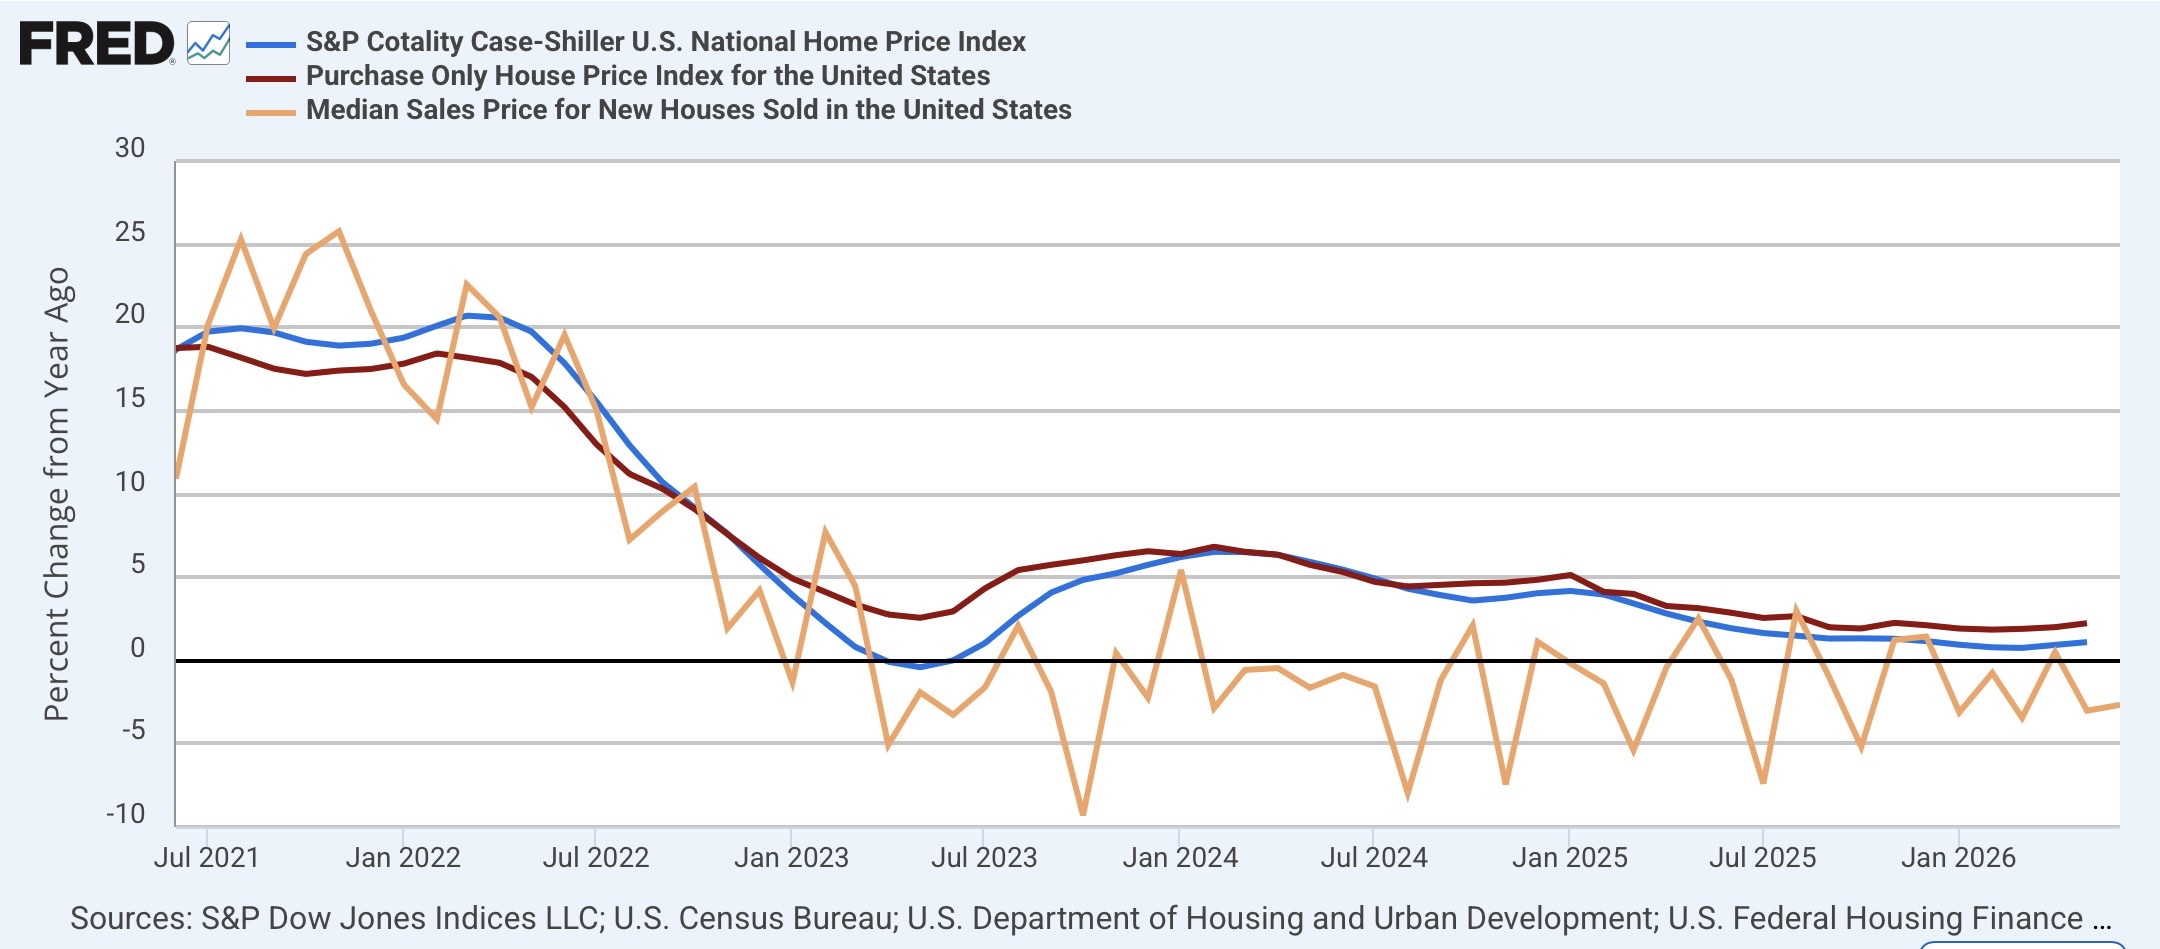
Again, this is similar to both Case Shiller (blue) and FHFA (red) repeat home sales indexes and the median price of new homes (gold), which are up only 1.1%, 2.2%, and down -3.0% YoY, respectively:
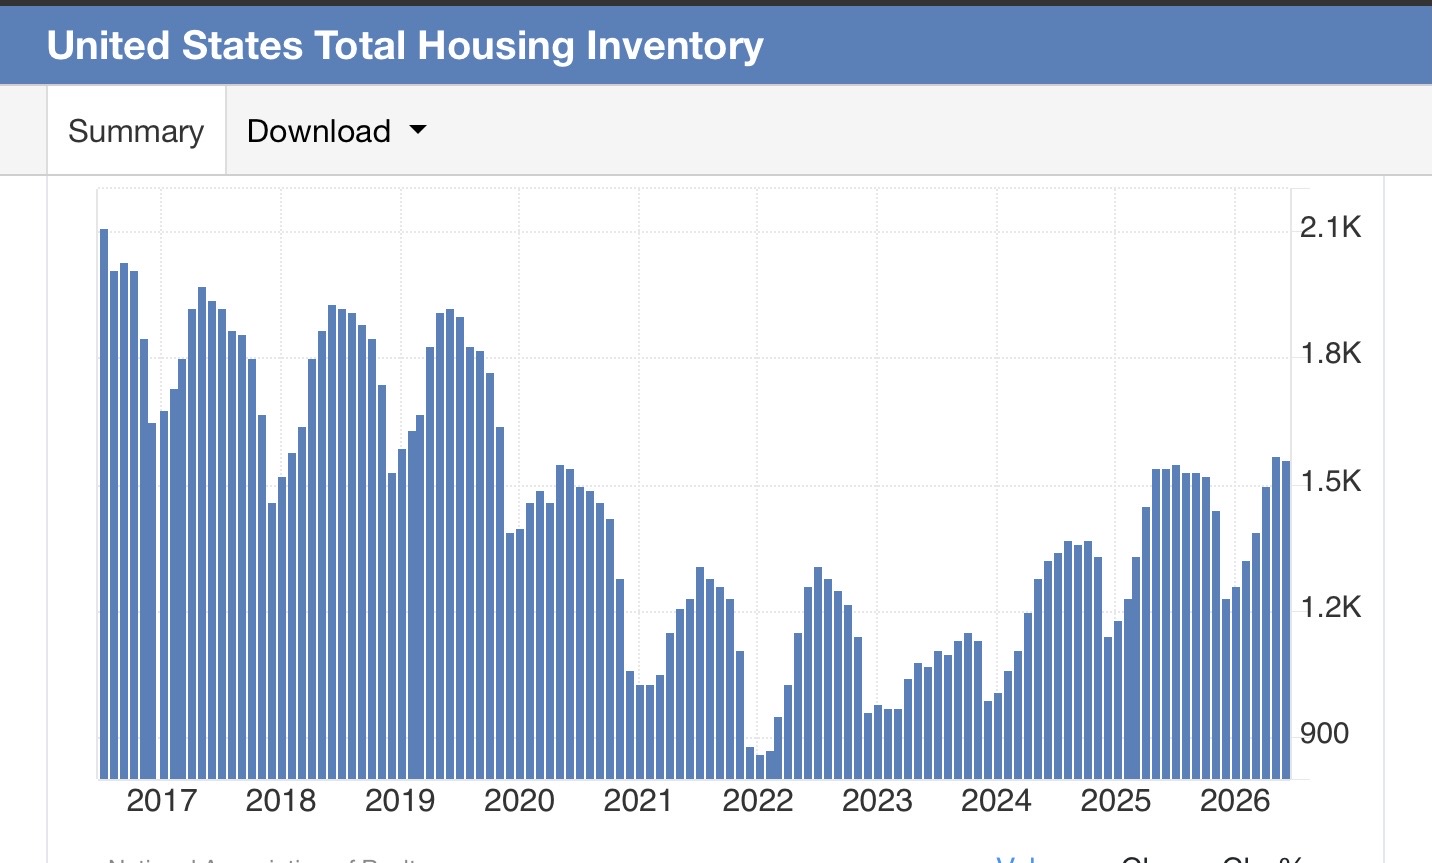
This year, the most lagging metric, inventory, has also fallen in line. In July, the YoY% change in existing home inventories was -0.6%. By contrast, as recently as last December it was up 7.9% YoY, and in March was up 4.5% YoY:
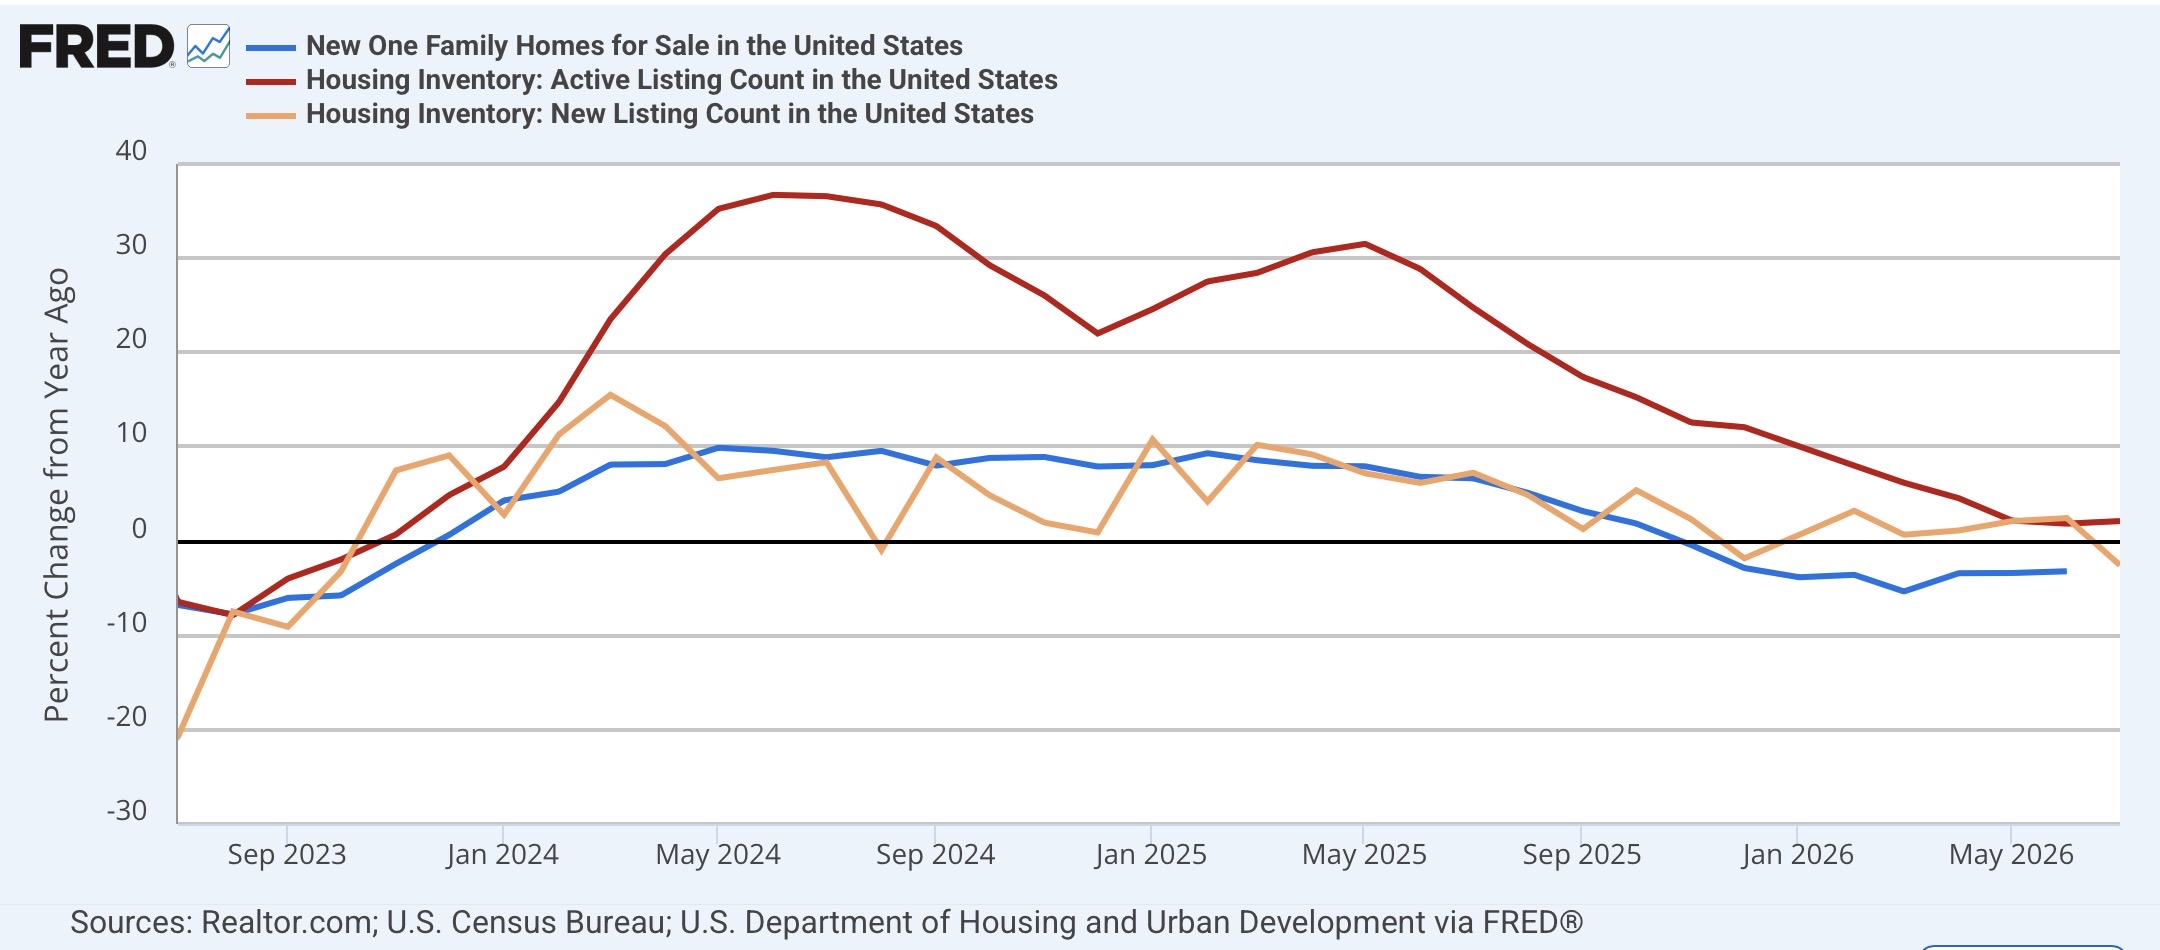
Again, we see similar flatness in YoY new home inventories (blue), down -2.4%, the active listing count of homes for sale nationwide (red), up 1.9%, and the new listing count (gold), up 2.4%:
So my conclusion this month is the same as last month. While there may be some slightly upward pressure on prices, with the background financial fundamentals the same, the existing home market has reached a suboptimal equilibrium, with something like a -500,000 decline in housing inventory available compared with ten years ago; and range-bound sales as well.



Comments
Log in or sign up to join the conversation.