

Nvidia Inc (NVDA) stock has been trading in a range for the past several months. This has attracted short-sellers of NVDA out-of-the-money options. Today, there is huge volume in less-than-2-week expiry NVDA OTM calls.
NVDA stock is at $214.01 in midday trading on Wednesday, July 22. It hit a $192.53 low on June 26, but is off a May 14 peak of $235.74. The Barchart graph below shows NVDA has been in a 3-month trading range.
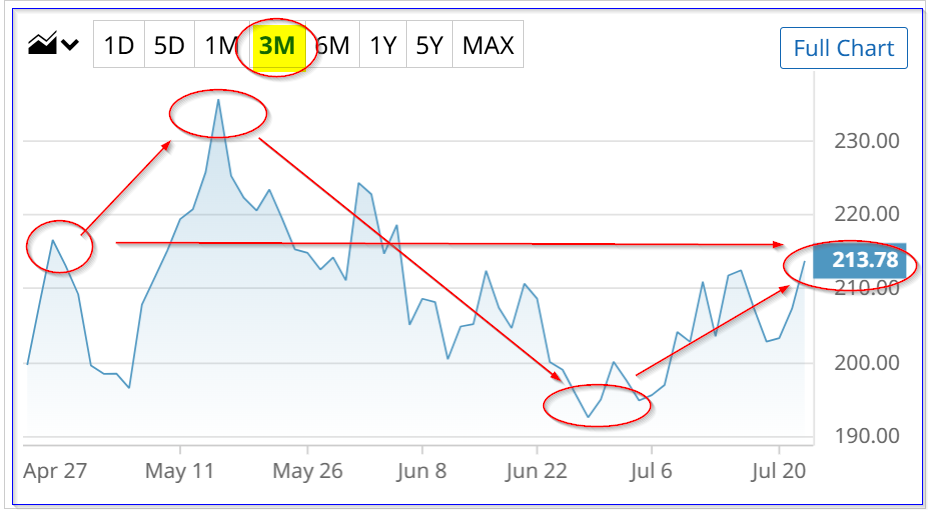
NVDA stock - last 3 months - Barchart - July 22, 2026
In a recent Barchart article on July 15 ("Huge, Unusual Put Options Volume in Nvidia - Are Investors Bullish or Bearish on NVDA?"), I showed that investors have been using this trading range to short out-of-the-money puts.
Unusual Call Options Volume Today
Today, the same activity is apparent, except with out-of-the-money calls. Investors have traded over 5,800 call options at the $235 strike price expiring on Aug. 3, 2026. That volume was over 43x the prior number of contracts outstanding at that strike price.
This can be seen in today's Barchart Unusual Stock Options Activity Report. It shows that the latest and midpoint premium for this contract was 43 cents. That represents a potential covered call yield of just 0.20% (i.e., $0.43/$214).
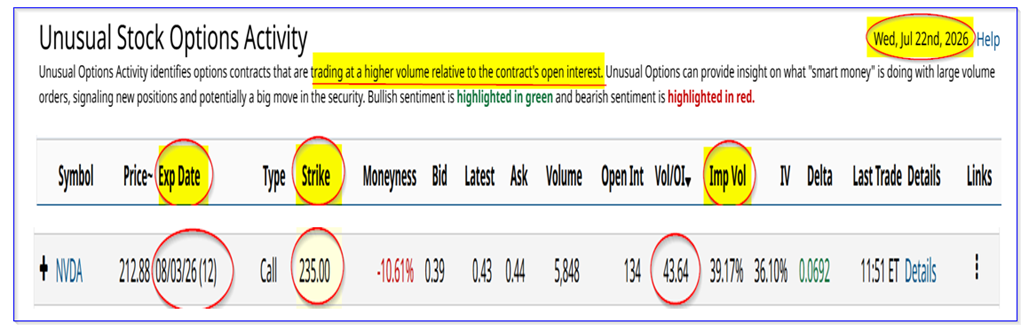
NVDA calls expiring Aug. 3, 2026 - Barchart Unusual Stock Options Activity Report - July 22, 2026
That is not a very high yield. For example, if an investor could repeat this 2.5 times per month (i.e., 30/12), they could earn an expected return (ER) of 0.50% (i.e., 0.20% x 2.5). Typically, short-call and short-put investors like to receive an ER of 1.0% per month.
Nevertheless, this shows that investors are taking advantage of the trading range that NVDA stock has been in for the past several months.
Analysts Still Love NVDA Stock
My July 12 Barchart article explained how Nvidia could be worth $311.59 per share, based on its strong free cash flow (FCF) and FCF margins. That's 45% over today's stock price.
However, since then, analysts have raised their 2027 revenue forecasts from $555.51 billion to $560.75 billion (Seeking Alpha) and $559.74 billion (Yahoo! Finance), or $560.25 billion on average.
As a result, using a 53.5% FCF margin estimate, the FCF estimate is $299.73 billion. That is the average between its most recent FCF margin (59.3%) and its trailing 12-month (TTM) FCF margin of 47.0% according to Stock Analysis data.
Using a 25.5 multiple (i.e., a 3.92% FCF yield), the stock could end up with a market value of $7.643 trillion. That is 47.3% higher than today's market cap ($5,189 trillion according to Yahoo! Finance).
In other words, the price target (PT) is 47.3% higher, or $315.22 per share ($214 x 1.473).
Other analysts have raised their PTs as well. For example, Yahoo! Finance shows an analyst survey PT of $302.31 (last week $301.62), Barchart is at $304.07 (last week $302.55), and AnaChart's PT is $298.47 (last week $298.20).
Summary and Conclusion
The bottom line is that analysts keep raising their price targets, based on higher revenue and FCF forecasts. The company is set to release its Q2 earnings for the quarter ending July 27.
So, using analysts' most recent revenue forecasts for next year and using its average FCF margin, along with its historical FCF yield metric, NVDA is worth over 47% more.
That could be why there is so much out-of-the-money call options activity today.



Comments
Log in or sign up to join the conversation.