

Every so often, we feel a need to remind ourselves to focus on the primary-trend of the market because it is too easy to get overly absorbed by short-term possibilities. The truth is, you don't make money by selling a bull primary-trend, or by buying a bear primary-trend. That is why, although we have taken profits off the table in anticipation of a near-term pullback (which is still missing in action), we remain 65% long.
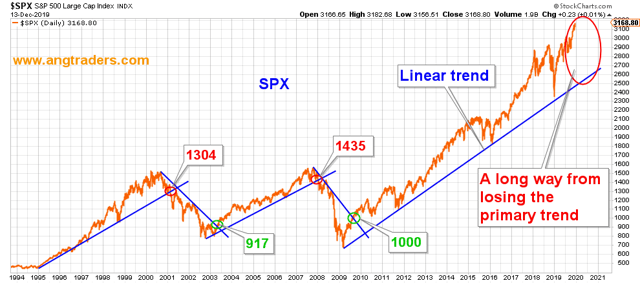
The primary-trend can be visualized either on a linear chart or on a logarithmic chart. In the former case, a simple straight line is drawn along the lows to determine the bull trend and along the highs for the bear trend (first chart below). When the SPX crosses the trend-line, the primary-trend is broken and a new trend is established.
(Click on image to enlarge)
On the log-scale chart, we use a Raff regression which produces upper and lower limits (chart below). In this case, a bull trend is broken if the extrapolation of the lower-limit line is breached (red dashed lines), and a bear trend is broken if the extrapolation of the upper-limit line is breached (green dashed-lines).
(Click on image to enlarge)
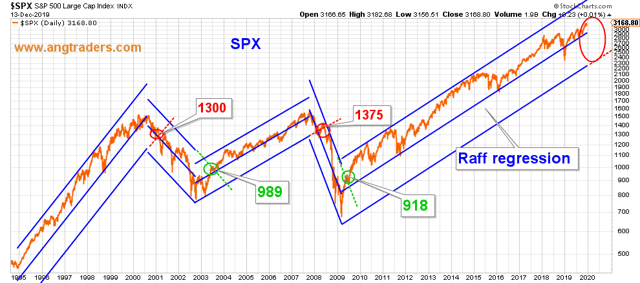
In both cases, the breach of the tech bubble happened at ~1300, but the breach of the housing bubble happened sooner on the linear chart (at 1435) than on the log chart (at 1375). The start of the housing bubble was also marked first on the linear chart (at 917), then on the log chart (at 989). But the start of the present bull market was market first on the log chart (at 918), then on the linear chart (at 1000).
The take-away lesson here is that we monitor both types of charts and act on whichever chart signals the change in trend first. At the moment, the SPX is a long way from losing the primary bull trend, on both the linear and the log charts.



Comments
Log in or sign up to join the conversation.