

Traders and investors don’t have a crystal ball, but we do have four technical indicators that can help us determine stock price moves.
In the technical analysis universe, there is no shortage of indicators to help us understand what a stock chart means. If you’re not versed in their usage, it can be confusing. “What tools do I use when?”
Nothing is a 100% guarantee of success. However, by combining four indicators, you’ll have a pretty good read on where price is headed – and more confidence in choosing a direction.
One small caveat: Having confidence about a trade does not equal permission to go overboard. Always follow your risk management rules and size your trade properly.
4 indicators that will help you determine stock price moves
Start with price and volume
Price and volume (the king and queen of the technical indicators) tell you where a stock price has been and where it is likely going. (Remember, a chart provides a picture of the past.)
When you’re looking at price, higher highs and higher lows indicate a bullish trend. Lower highs and lower lows indicate a bearish trend.
Layer on volume trends, and you have a very clear picture of how strong that trend is.
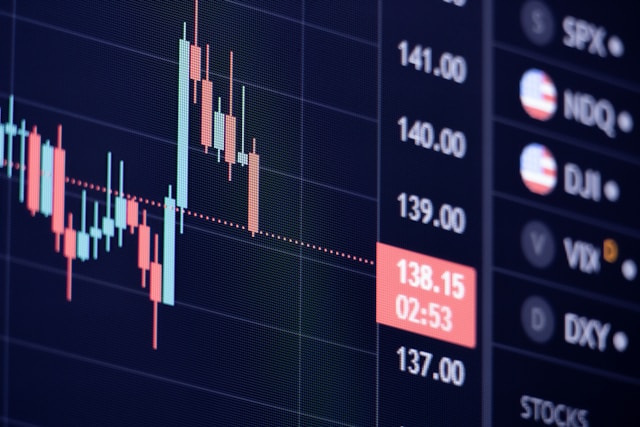
For example, candlesticks on a chart show you established volume patterns. Green are bullish, red are bearish. The taller the candlestick, the stronger the trend. Traders and investors are feeling good about the stock and buying it hand over fist. The reverse is true too. The smaller the candlestick, the less conviction among traders and investors.
Look at moving averages next
You can get a good read ob volatility by using moving averages, which tell you the average price of a stock over a specific time period. Shorter-term ones like the 8-, 10- or 20-day are quite noisy, but they also tell you a lot about the future price trend of the stock.
Moving averages act like a magnet for price. Meaning, price often likes to return to the moving average. If you look at a chart, you’ll see that price often “hugs” the moving averages.
Finally, study the MACD
The MACD (moving average convergence/divergence) indicator compares moving averages over different timeframes to measure the trajectory of the price action. Look for price crossovers on the MACD line. This indicates a change in trend, whether from from bearish to bullish or vice versa. It has a great track record of telling you when a trend will change. In fact, it’s the closest thing we have to a crystal ball.
These tools can also help you avoid a bad trade, which is just as important as finding a solid trade. I think of them like a polygraph test; they tell the truth. So whatever they’re telling you, believe them.



Comments
Log in or sign up to join the conversation.