
One important factor in the growth prospects for the US economy is the trajectory of the dollar. [1] If dollar stabilizes at March levels, US economic growth might rebound. On the other hand, continued appreciation bodes ill. Based on history over the floating rate era, the expected duration of an appreciation is about 5 years (depreciations about 2 years). The current surge in the dollar has only been going on for only slightly over half a year, although when dated from the trough of 2011Q2, it’s been going on just a bit over 4 years. Either way, by this metric, it appears that there is still some additional way to go before the dollar peaks.
Figure 1 shows the evolution of the real value of the dollar against a broad basket of currencies; description of the construction of such indices is detailed in this paper.
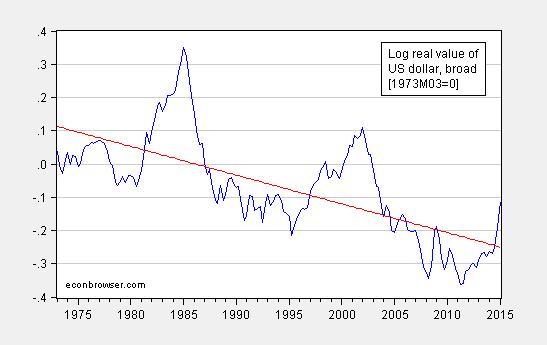
Figure 1: Log real value of US dollar against broad basket of currencies (blue) and linear trend (red). Source: Federal Reserve Board and author’s calculations.
While it is common to characterize exchange rates as a random walk, for real rates, this characterization is not completely apt. One can reject a unit root (allowing for a trend) at marginal levels, using the Elliott-Rothenberg-Stock unit root test. The trend obtained using OLS indicates a trend depreciation at about 0.9% per year.
More interestingly, an inspection of Figure 1 suggests that there are long swings in the dollar’s value. This observation is not new, and was first made 25 years ago by Engel and Hamilton (AER, 1990). The fact that when the dollar appreciates, it continues to appreciate is suggestive that the dollar’s current ascent is not yet over.
Long Swings Re-evaluated
In order to make an updated assessment, I take data over the 1973-2014 period, and estimate a Markov Switching model. The dependent variable is the year-on-year change in the log value of the dollar, sampled in the fourth quarter of each year.
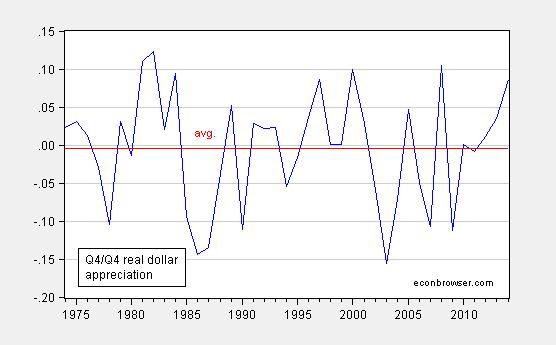
Figure 2: Q4/Q4 change in log real value of US dollar against broad basket of currencies (blue) and average over 1974-2014 (red). Source: Federal Reserve Board and author’s calculations.
A common coefficient is placed on a dummy variable for the financial crisis, taking on a value of unity in 2008. Assuming a constant variance over two regimes, I estimate an upswing regime with real appreciation of 3% per annum and downswing regime with real depreciation of 10% per annum. The financial crisis appreciated the dollar by 20%, according to the estimates (see here).
The probability of staying in regime 1 (appreciation) conditional on being in regime 1 is 81%; the probability of transitioning to regime 2 (depreciation) from regime 1 is 19%. The probability of staying in regime 2 conditional on being in regime 2 is 44%; in contrast, the probability of transitioning into regime 1 when in regime 2 is 56%.
The smoothed regime probabilities are presented in Figure 3:
Figure 3: Smoothed regime probabilities for regime 1 (appreciation) and regime 2 (depreciation) estimated on annual data, 1974-2014. Source: Federal Reserve Board and author’s calculations.
Hence, as of 2014, the US dollar was likely in appreciation regime. Using semi-annual data, one obtains similar implications (the dollar is an appreciation regime), but the expected duration is somewhat shorter – a bit less than three years for an appreciation regime, and a year and a half for depreciation regime. In this case, the dollar appreciation is already a big long in the tooth. The ambiguity is not unexpected; Engel (1994) found that it was hard to exploit the long swing characteristic in such a way as to outperform a random walk.
I tend to favor the interpretation associated with the one year changes in the real rate given that this matches with the interpretation of long swings seen in Figure 1.
A Threshold View
Another way of interpreting the data exhibited in Figure 1 is to think of there being thresholds around (possibly trending) parity in the real exchange rate (e.g., the red line). The thresholds could be sharp (e.g., O’Connell, JIMF, 1998), or smooth (e.g, Taylor, Sarno, Peel, IER, 2001, among many others). Close to parity (in this interpretation, close to the red line), reversion to trend would be very slow, and far away, quite rapid.
O’Connell (1998) sets the threshold at 0.12 for the US bilateral (CPI-deflated) exchange rate against other industrial countries, estimated over 1979-95. In the smooth threshold approach, the pace of reversion is monotonically faster the farther away from parity. In Taylor, et al. estimates, a 40% shock has a half-life of a deviation of less than a year; a small shock has a half life of over three years (for two key bilateral US real rates, over the 1973-1996 period.
This idea of thresholds has made it into the practitioner literature. Figure 2 displays the Deutsche Bank (March 30, 2015 [not online]) take on the nominal rate; fair value is defined by purchasing power parity (relative price levels).
Figure 2 from Chadha, Thatte, Tierney, “Global Asset Allocation: The Dollar fast cycle,” World Outlook, March 30, 2015 [not online].
Hence, this graph is the nominal analogue to Figure 1 (except the currency baskets are different). The +/- 20% bands are their interpretation of the relevant thresholds. DB assesses the dollar at 10% above parity as of March 2015. Using the estimated real dollar trend (which assumes cointegration between the exchange rate and relative prices with unit coefficient), my calculation in Figure 1 implies the dollar is 14% overvalued, and thus yet to breach the threshold.
Summing Up
By the long-swing metric, there seems to be some more appreciation in store. The same is true using a threshold approach. However, these conclusions are based upon historical patterns, for which there are not many independent observations – two and a half dollar cycles essentially. In addition, there is no guarantee that these patterns will persist. From Chadha, Thatte, and Tierney:
The US dollar has risen since last summer against the major currencies at the fastest paces on record, up 21%. Compared to a typical dollar cycle that spans from 20% below to 20% above fair value over 6-7 years, we have seen 3 years of appreciation packed into 9 months. Current levels put the dollar 10% above fair value and 3/4 of the way through a typical cycle.
In other words, the sheer rapidity of the dollar surge may mean a different outcome this time around, and the dollar appreciation might end sooner than suggested by the previous discussion. That would remove some of the drag on economic growth [1]


Comments
Log in or sign up to join the conversation.