

Data through October 23, 2026.
I measured the stock move on the first trading session after every quarterly earnings release by current S&P 500 companies since April 2020: 12,353 reports from 493 companies. The average price move was 4.6% and the median was 3.3%, counting the size of both gains and losses regardless of direction. The median move was about three times a normal day’s move for the same stock. What I didn't expect is how much bigger the moves have become.
Reports from | Reports | Average move | Median move | Moved 10% or more |
|---|---|---|---|---|
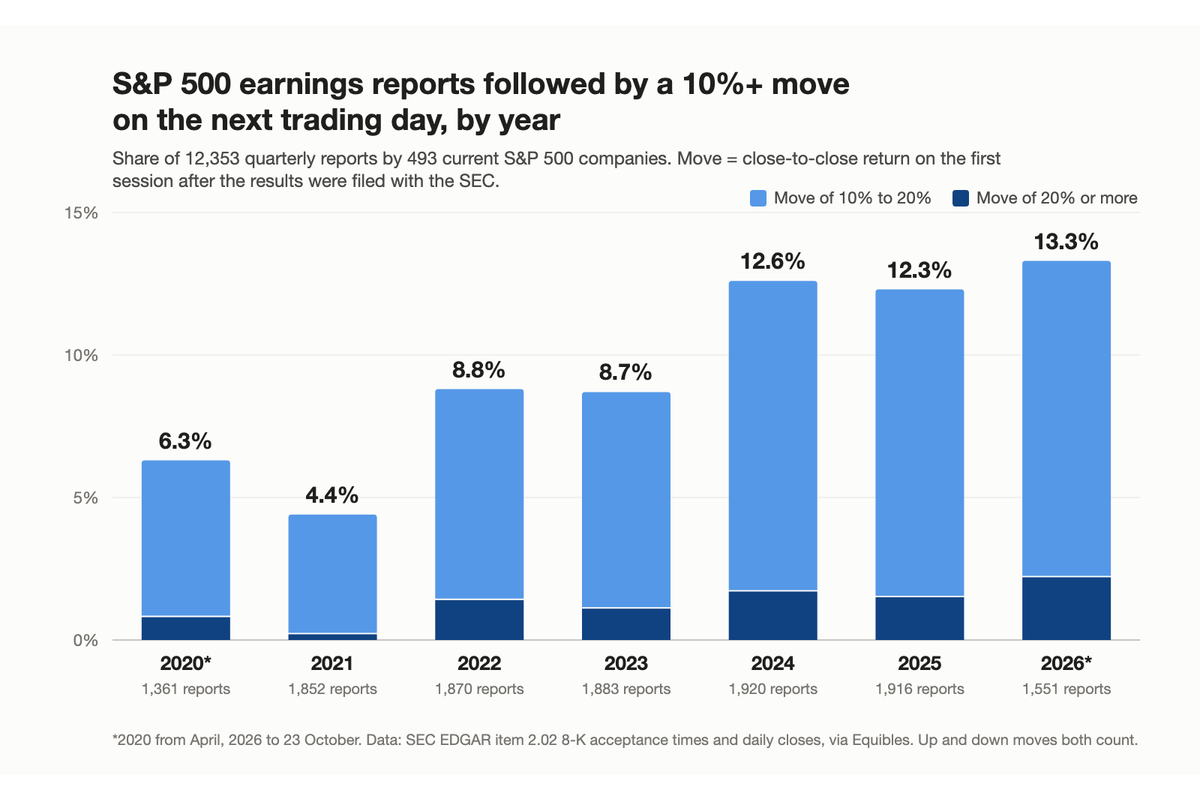
Apr to Dec 2020 | 1,361 | 4.0% | 3.0% | 6.3% |
2021 | 1,852 | 3.4% | 2.6% | 4.4% |
2022 | 1,870 | 4.6% | 3.3% | 8.8% |
2023 | 1,883 | 4.4% | 3.3% | 8.7% |
2024 | 1,920 | 5.1% | 3.9% | 12.6% |
2025 | 1,916 | 5.0% | 3.6% | 12.3% |
Jan 1 to Oct 23, 2026 | 1,551 | 5.3% | 3.9% | 13.3% |
In 2021 about one report in 23 moved the stock 10% or more. This year it is more than one in eight.
Five findings
1. It isn't index turnover. Newer, more volatile companies joining the S&P 500 could explain the trend, so I reran it on the 358 companies that reported in every year. Their average move went from 3.3% in 2021 to 5.2% in 2026, and the 10% share from 4.1% to 13.2%.
2. After the close moves more than before the open. Releases after the close were followed by a 5.1% average move, against 4.1% before the open. Part of that is who reports when: technology companies put out 68.5% of their results after the close, industrial companies 22.7%. The after-close share itself has stayed between 43% and 45% a year.
3. Earnings moves vary sharply by sector. Over the last four quarters, technology stocks moved 8.0% on average and 28.2% of their reports moved the stock 10% or more. Utilities moved 1.9%. Eight of the ten calmest stocks on earnings are utilities.
4. The big moves don't keep going. Of the 4,119 reports followed by a move of 5% or more, the stock moved further in the same direction the next day 51.4% of the time, and the average next-day follow-through was 0.06%. A coin toss.
5. October has been calm so far. The 108 reports from October 1 to 23 moved stocks 3.6% on average, against 4.0% in the same weeks of 2025. The early weeks are mostly banks and industrial companies, though, and 133 S&P 500 companies report from October 26 to 30.
October 26–30, 2026 Reporters With the Biggest Past Moves
Company | Call date | Average move, last eight reports | Largest |
|---|---|---|---|
Twilio (TWLO) | Oct 29 | 15.8% | 24.9% |
Reddit (RDDT) | Oct 29 | 14.7% | 42.0% |
West Pharmaceutical Services (WST) | Oct 29 | 13.2% | 38.2% |
Carvana (CVNA) | Oct 28 | 12.2% | 19.3% |
Huntington Ingalls (HII) | Oct 29 | 11.9% | 26.2% |
Teradyne (TER) | Oct 28 | 11.5% | 20.5% |
Garmin (GRMN) | Oct 28 | 10.9% | 23.2% |
Intel (INTC) | Oct 29 | 9.3% | 23.6% |
Among the largest companies, Microsoft (MSFT) has averaged 7.0% over its last eight reports and Alphabet (GOOGL) 4.1%. A company's past moves describe how much its earnings have surprised investors before, not how much they will this time.
How I measured it
The release time comes from the SEC. Each release is the company's item 2.02 8-K, timed by its EDGAR acceptance timestamp. Before 4 p.m. New York time I use that day's close-to-close return; after the close, the next session's.
One timestamp field isn't enough. The acceptance time in EDGAR's submissions JSON didn't always agree with the filing's own header file, sometimes by several hours. Where they disagreed about the trading day, I used the header.
Pick the right 8-K. Some companies file a preliminary 2.02 8-K days before the real results. Keeping the latest one on or before the call date avoids merging the two.
Checked against known call times. For calls with a known start time, the inferred reaction day agreed with the call time 98.4% of the time.
Splits and the market. Windows around stock splits are excluded. Subtracting the median S&P 500 move that day only lowers the average from 4.6% to 4.5%.
The sample uses S&P 500 membership as of October 22, 2026, and includes those companies’ earlier reports, even before they joined the index. Companies that left the index before that date are excluded.
The full study has the quarterly series, the sector table, the stocks that move most and least, and the twelve biggest single moves since 2020 (AppLovin's (APP) +46.3% on November 7, 2024 leads): How Much Do Stocks Move After Earnings? Evidence From 12,353 S&P 500 Reports.
Comments
Log in or sign up to join the conversation.