


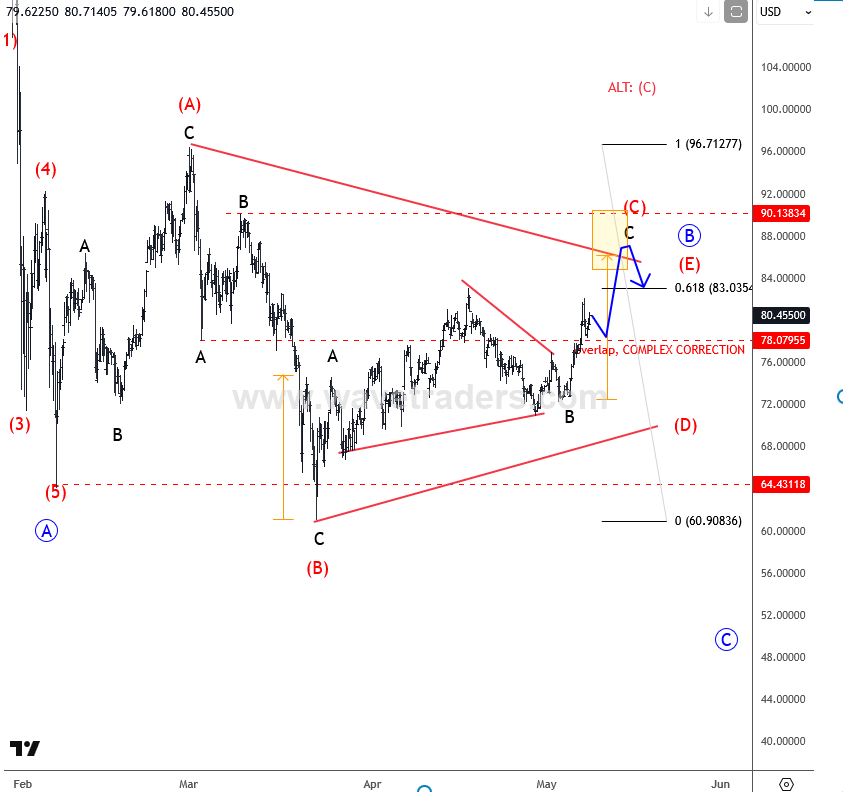
Back in May, we highlighted the upper resistance zone between 85 and 90 as a potential reversal area, and the market reacted almost perfectly from that region. The rejection came right from our projected resistance box, followed by a very sharp impulsive decline that confirmed sellers were stepping back in aggressively.
This was a great example of how combining Elliott Wave structure with resistance zones and triangle patterns can help our clients identify high-probability turning points in advance. Once the recovery showed overlapping corrective behavior into resistance, it increased the probability that the rally was only temporary and that a larger bearish leg was about to resume.
Specifically, we use yellow boxes on our chart, call them as potential trade reversal box, that can help our members focus on potential setups.
As of today, Silver is coming perfectly lower from our resistance area between 85 and 90, highlighted with the yellow box, from where we are seeing a very sharp and strong selloff. It certainly looks impulsive, so be aware of more weakness ahead. We believe this drop is part of wave D, which should unfold in three waves, so more downside is likely, possibly back towards the previous subwave B swing lows with support around the 67 to 72 area.
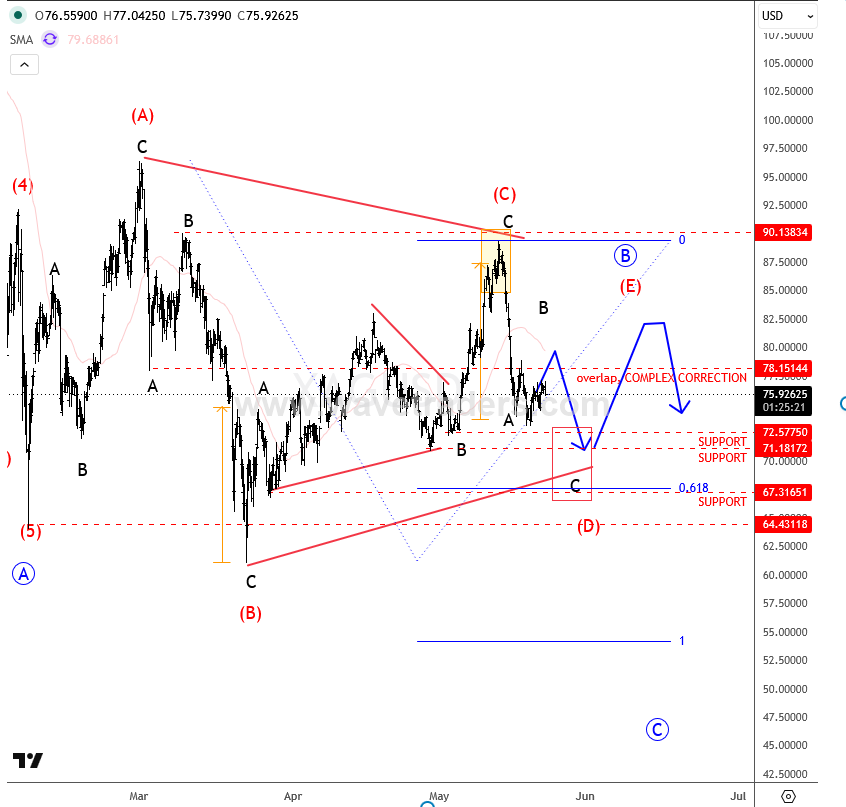
So overall, it’s very possible that the market remains trapped within this higher degree wave triangle range, but the current price action clearly confirms that the whole decline from the February highs is far from over and that bears may still push prices lower this year, with major support around the 50 area visible on the daily chart.



Comments
Log in or sign up to join the conversation.