

Please consider the Census Department report on Advance Retail Sales for June of 2026.
Advance estimates of U.S. retail and food services sales for June 2026, adjusted for seasonal variation and holiday and trading-day differences, but not for price changes, were $768.6 billion, up 0.2 percent (±0.4 percent) from the previous month, and up 6.7 percent (±0.5 percent) from June 2025.
Total sales for the April 2026 through June 2026 period were up 6.4 percent (±0.5 percent) from the same period a year ago.
The April 2026 to May 2026 percent change was revised from up 0.9 percent (±0.4 percent) to up 1.0 percent (±0.2 percent).
The key phrase above is “adjusted for seasonal variation and holiday and trading-day differences, but not for price changes.”
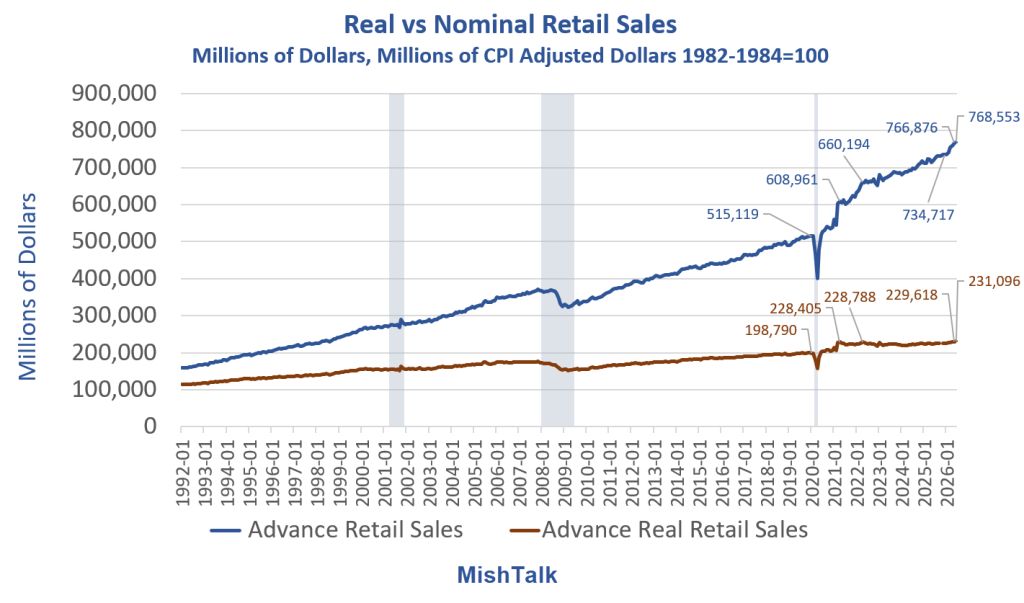
The report only lists nominal sales, not real (inflation-adjusted sales). It’s real sales that feed GDP.
Real vs Nominal Retail Sales in Millions of Dollars
Real vs Nominal Sales Notes
Real retail sales peaked in March of 2021 at 233,440. They are now 231,096 That’s a decline of 2,344 or 1.0 percent.
In March of 2021, nominal sales were 603,581. They are now 768,553. That’s an increase of 153,504 or 27.3 percent.
Over 100 percent of the increase in nominal retail sales since March of 2021 is due to inflation.
Real Retail Sales Detail
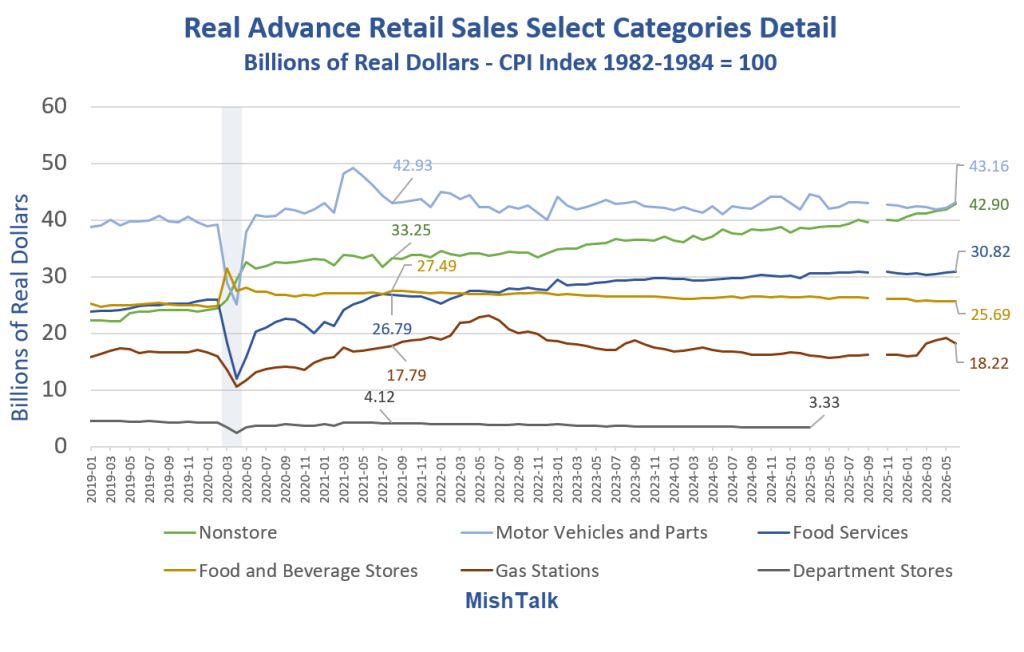
The Covid-related impacts were over by August 2021. That’s the first set of numbers above.
Amazon (AMZN) captures roughly 36% to 40% of total U.S. online/non-store e-commerce sales. In broader terms, this translates to Amazon accounting for over 10% of all U.S. retail spending overall
Real Retail Sales Billions of Real Dollars
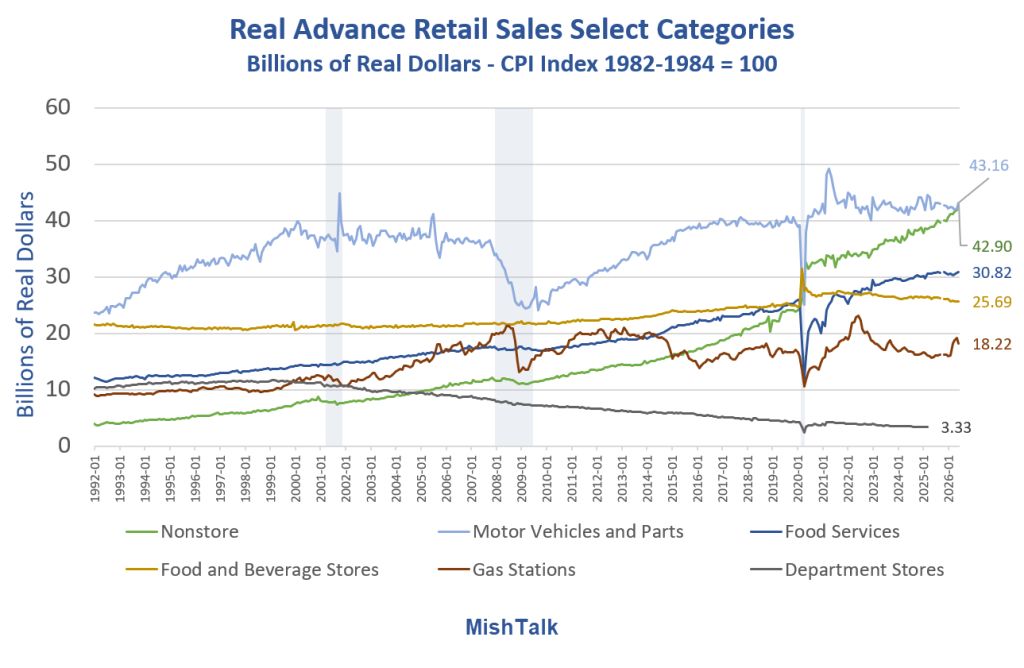
Nonstore: 42.90 up 29.02 percent since Aug 2021
Motor Vehicles and Parts: 43.16 up 0.53 percent since Aug 2021
Food Services: 30.82 up 15.04 percent since Aug 2021
Food and Beverage Stores: 25.69 down 6.54 percent since Aug 2021
Gas Stations: 18.22 up 2.4 percent since Aug 2021
Department Stores: So meaningless that the BLS stopped gathering data starting April 2025
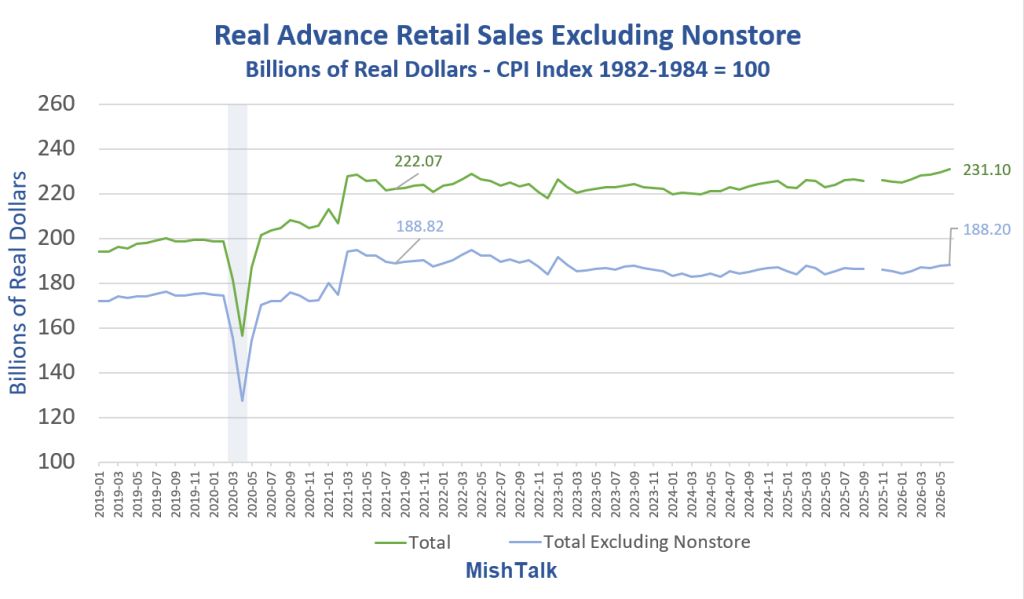
Total: 231.10 vs 222.07 in Aug 2021 up 4.07 percent
Total Excluding Nonstore: 188.20 vs 188.82 in Aug 2021 up 0.33 percent
Real Advance Retail Sales Excluding Nonstore
The sum of Nonstore, Motor Vehicles and Parts, Food Stores, Food Service, and Gas Stations is 160.79 billion.
That’s 69.6 percent of the total.
Nonstore sales and food service (eating out) is over 100 percent of the growth in real retail sales since August of 2021.
Most of that increase is nonstore. Nothing else is growing except volatile gas station sales.
Real Advance Retail Sales Percent Change Year-Over-Year
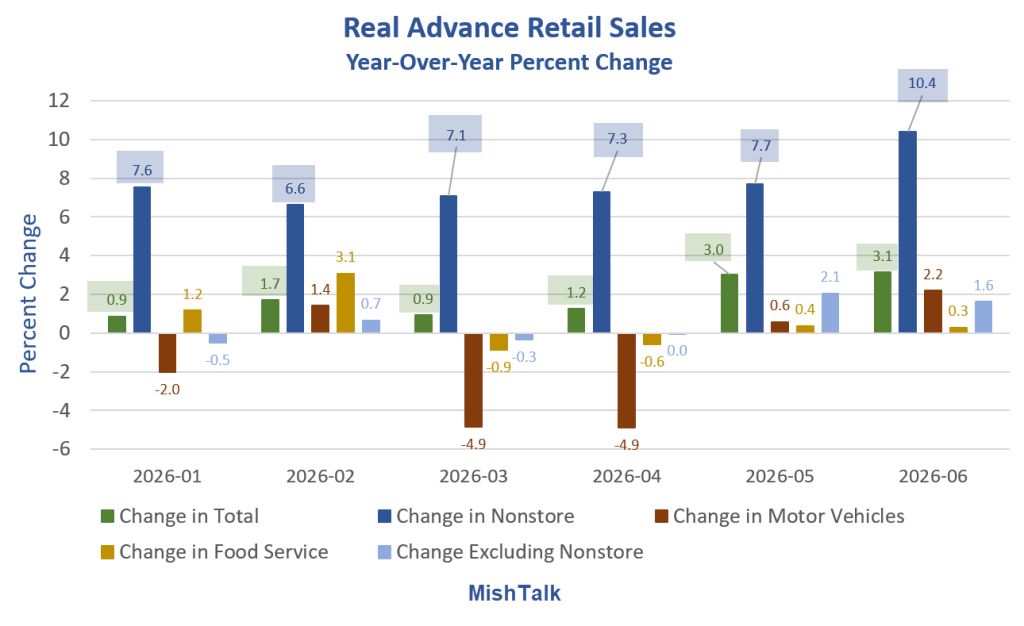
Nonstore sales and to a lesser extent food service are the only drivers of retail sales. Recent numbers show food service is faltering.
So, if people slow down online shopping, this economy is toast.
Related Posts
July 13, 2026: Congratulations to Trump for Spiking the Price of Oil and Bond Yields
Not everyone has powers like this.
July 14, 2026: CPI Drops 0.4 Percent M/M, the Largest One-Month Decrease Since April 2020
The bond market reaction suggests the decline is temporary. I concur. Gasoline was a key component, down 9.7 percent in June.
July 16, 2026: Autos and Nonstore Retail Sales Both Strong in June, Gasoline Down
The combination of autos and nonstore propelled real retail sales in June.

Comments
Log in or sign up to join the conversation.