

The economy has steadily been moving closer to the Fed’s long-run objectives. But we’re still not there yet.
Congress has given the Federal Reserve the dual mandates of maintaining price stability and full employment. The Fed has interpreted this in practice to mean an inflation rate of 2% and an unemployment rate a little under 5-1/2 percent.
Why not try to get unemployment even lower? Economic theory and historical experience suggests that an unrealistically low target for unemployment is unsustainable. According to this view, there is a level of the reported unemployment rate, sometimes referred to as the “natural” rate of unemployment, such that if we tried to keep unemployment any lower than that rate, the inflation rate would steadily increase every year. The Congressional Budget Office estimates that the natural rate of unemployment is currently around 5.4%.
The data graphed below provide some weak support for that theory. The vertical axis marks the difference between the inflation rate in year t and the rate in year t – 1. I measured inflation using the year-over-year percent change in the PCE deflator as of February of each year, choosing February because that’s the most recent month for which we have a 2015 value for the PCE deflator. Dots above the y = 0 axis correspond to years when the inflation rate was higher than the year previously. The horizontal axis marks the difference between the unemployment rate (again measured as of February in each year) and the natural rate of unemployment as estimated by the CBO. Dots to the right of the x = 0 axis correspond to years when the unemployment rate was above the natural rate. The dots trace out a weak negative correlation (R2 = 0.13, slope = -0.34, Newey-West t-statistic = -2.3). The relation suggests that if we maintained an unemployment rate at 4.4% (one percentage point below the estimated natural rate), the inflation rate during this year might be expected to come in at 0.6% (or 0.3% above the current 0.3%), the following year at 0.9% (or 0.3% above next year’s anticipated inflation rate), and so on. We couldn’t stay in such a situation forever, though obviously there’s a lot of error in the equation’s predictions.

The relation graphed above is one version of the Phillips Curve. The underlying theory motivating the form I’ve used in the graph above is based on a model of adaptive expectations in which people expect an inflation rate this year equal to whatever they observed inflation to be last year. I have elsewhere discussed some other approaches to incorporating inflation expectations into the Phillips Curve. If people catch on more quickly that inflation is headed up than is implied by the adaptive expectations assumption, the increase in inflation would come faster than predicted by the regression estimated above.
The second objective of the Fed is to keep inflation around 2%. Many people understand why the Fed doesn’t want to see inflation above 2%. But why is it a bad thing when inflation gets below 2%? If we could count on inflation every year of 1%, there probably isn’t much of a problem. But the issue is that we can’t count on that. A 1% target in practice means some years with negative inflation (also known as deflation). The concern is that if we get hit with a big enough deflationary shock, that could put the economy into a deflationary spiral in which unemployment gets stuck well above the natural rate and prices fall every year, aggravating debt burdens and accelerating bankruptcies. The U.S. managed to avoid a deflationary spiral in the Great Recession of 2007-2009, but these unfavorable dynamics likely did play a role in worsening the economic loss during the Great Depression of 1929-1933.
Federal Reserve Bank of Chicago President Charles Evans has proposed summarizing the Fed’s inflation and unemployment objectives in terms of a bull’s-eye picture. I’ve centered the bull’s-eye below assuming a long-run inflation target of 2% and a natural unemployment rate of 5.35%. We’d like to be as close to the center of the target as possible. We’re about there in terms of the unemployment objective, but inflation is still well below 2.0%.
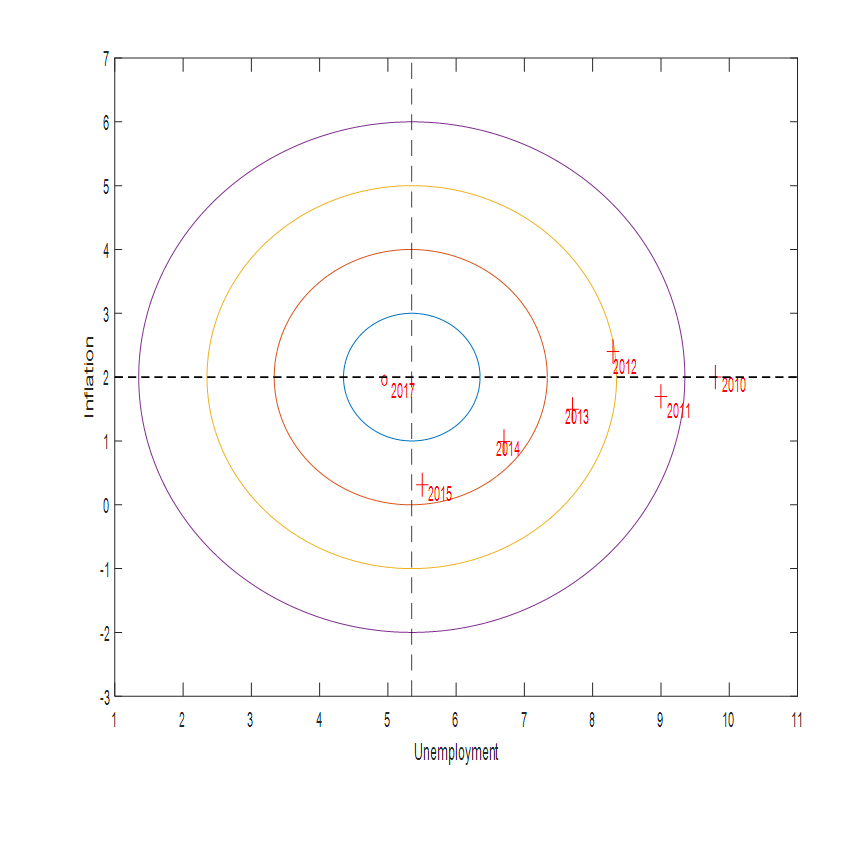
Horizontal axis: civilian unemployment rate. Vertical axis: inflation rate as measured by year-over-year percent change in implicit price deflator for personal consumption expenditures. 2017 entry represents FOMC projections. Crosses denote values for February unemployment and February year-over-year inflation for indicated year. Adapted from Evans (2014).
The tricky thing about navigating to the target is that the economy responds with a considerable delay to any actions the Fed takes today, and there is a lot of uncontrolled variability in both inflation and unemployment. Nevertheless, the above quick calculations persuade me that it is too early for the Fed to start raising interest rates. At its March meeting, the FOMC declared:
The Committee anticipates that it will be appropriate to raise the target range for the federal funds rate when it has seen further improvement in the labor market and is reasonably confident that inflation will move back to its 2 percent objective over the medium term.
I’d want to see some more data before being reasonably confident about that second item.
Comments
Log in or sign up to join the conversation.