

Photo by todd kent on Unsplash
Based on mortgage rates, home prices, and average hourly earnings, it currently takes roughly 64 hours of work to cover a monthly mortgage payment.
Below is a look at this reading going back to the early 1970s so you can see how housing affordability has shifted over the last five decades.
Affordability was at its worst in the late 1970s/early 1980s when mortgage rates spiked into the teens, but from there it was a steady trek lower all the way until the early 2010s as rates declined.
At its nadir in 2012, it took just over 32 hours of work to cover a monthly mortgage payment, so the current number is double that.
We've at least seen affordability get a little better over the last few years. At its peak in October 2023, it took 76 hours of work to cover a mortgage payment, which was the highest reading since late 1990.
As you can see in the chart, while mortgage costs are indeed high relative to the last couple of decades, these types of levels were routine through the 1980s and 1990s.

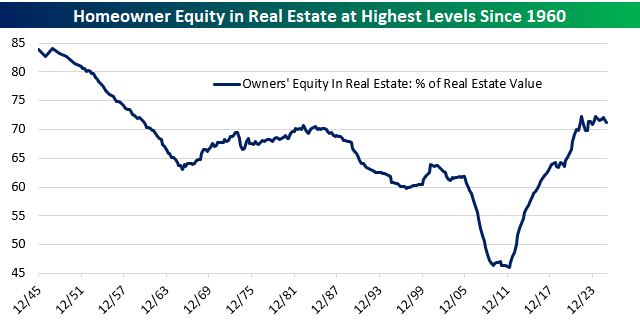
While affordability is worse now than it was during the ultra-low rate environment in the years after the Financial Crisis, homeowners are sitting on a boatload of equity. As shown below, homeowner equity plunged to just over 45% at its low point after home prices crashed in the late 2000s and early 2010s.
Low mortgage rates throughout the 2010s spurred a bounce-back in both home prices and loan activity, and then when prices spiked again in the early 2020s after COVID hit, homeowners were suddenly sitting on their highest amount of equity since 1960!
While home prices haven't gone up in a few years, they also haven't dropped, so that homeowner equity in the system remains a nice cushion.
Speaking of home prices, below is a look at the median listing price of homes from Realtor.com data over the last ten years.
After a huge move higher in listing prices in the first two years after COVID hit in early 2020, we've seen prices flat-line.
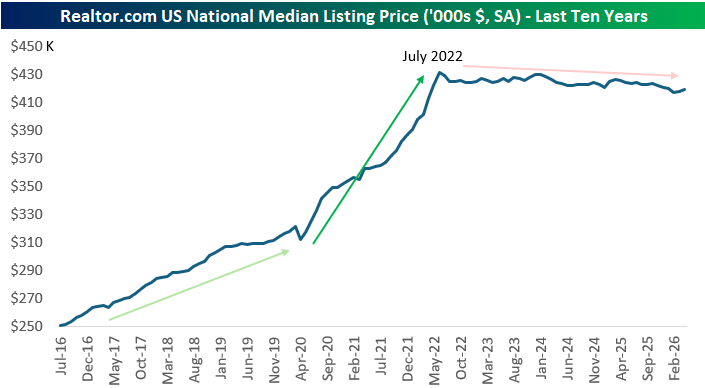
The two-year post-COVID surge could have just been one big multi-year pull forward in prices, however.
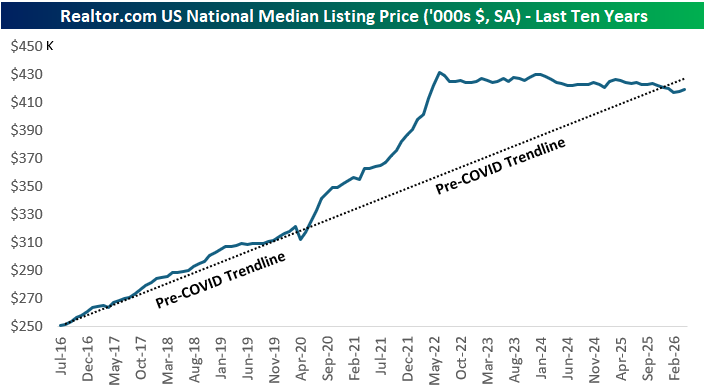
As shown below, if we extend out the pre-COVID trendline in listing prices all the way out to current levels, we're currently right on trend. We just didn't get there in a straight line.
Below is a look at the change in the median listing price versus the change in the homebuilder ETF (ITB) since 2016:
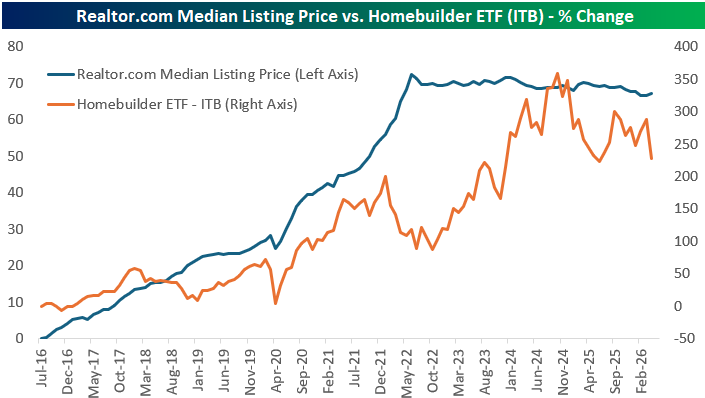
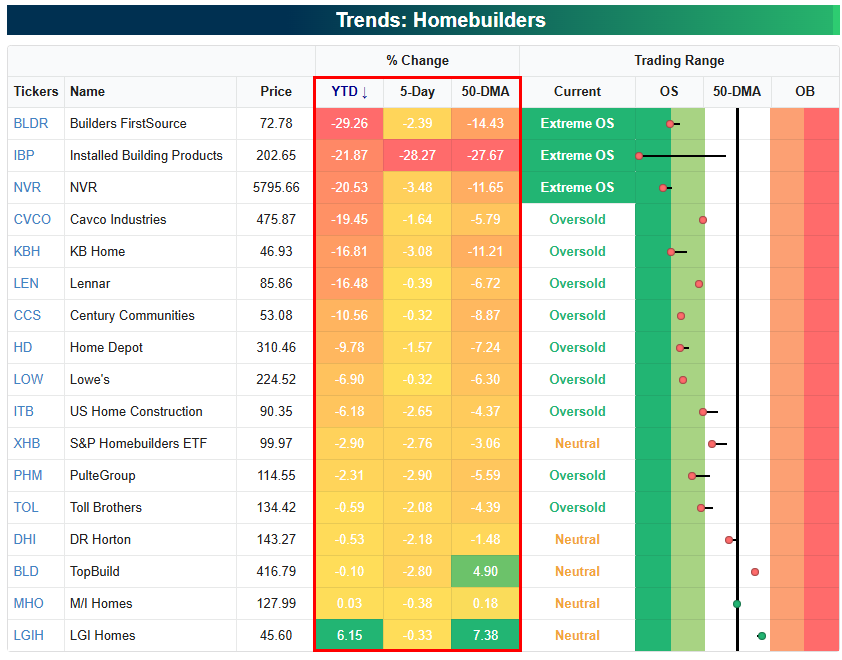
As shown below, the homebuilder space continues to get beaten up, with most stocks in the group at least 5% below their 50-DMAs in oversold territory. It's been a rough 2026 so far, with ITB down 6.2% versus a gain of 9% for the S&P 500.
It's likely that the builders will need to see some combination of lower rates or higher prices to get back on track.


Comments
Log in or sign up to join the conversation.