

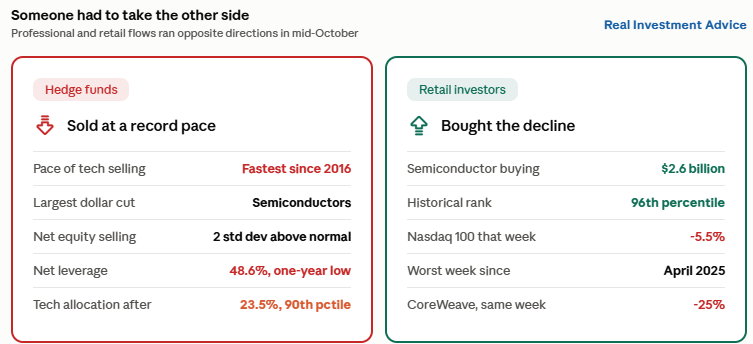
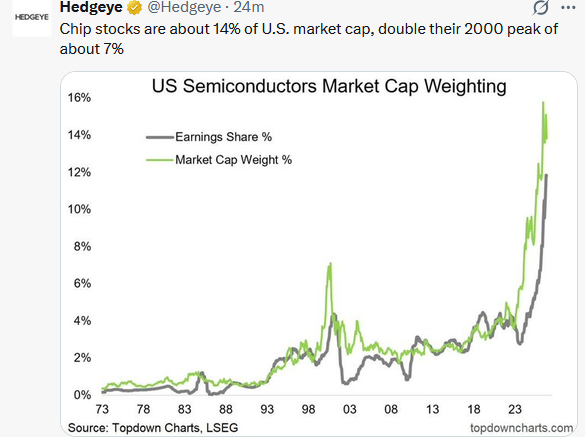
According to Goldman Sachs prime brokerage division, hedge funds cut technology positions in mid-October at the fastest rate since 2016. The selling helps explain recent weakness in the Nasdaq 100, which recently had its worst week since April 2025. Goldman’s data also shows that global AI stocks gave back every dollar of net buying hedge funds had accumulated since early 2025. The data, which some may read as suggesting hedge funds are bracing for a decline, is a little misleading.
Technology shares still represent 23.5% of Goldman’s global prime book, putting it in the upper 90th percentile over the past five years. While total technology holdings matter, what’s more telling is the speed of the reductions. To that end, hedge fund net leverage fell to a one-year low of 48.6%, suggesting they reduced leverage in a more defensive posture but kept their exposure to technology stocks.
That distinction is important. Selling at a record pace from a 90th-percentile allocation is not capitulation. It is a crowded trade getting marginally less crowded. There remains considerable room to deleverage and sell if the AI financing story deteriorates further. However, now there is room for hedge funds to lever back up into the technology sector.
Retail investors, known by institutional investors as the “dumb money,” bought $2.6 billion of semiconductors the same week hedge funds sold aggressively. $2.6 billion is a 96th-percentile reading. When professionals sell a crowded position and retail steps in to absorb it, the market has historically viewed that as a bearish signal. Recently, however, the “dumb money” has been on the right side of the trade more often than not.
What To Watch Today
Earnings
Earnings
Tuesday, October 27, 2026. Q3 reports from market-moving names.
Company (Ticker) | Timing | EPS est. | Rev. est. |
|---|---|---|---|
Boeing (BA) | Before open | -$0.20 | $24.37B |
Coca-Cola (KO) | Before open | $0.88 | $12.93B |
UPS (UPS) | Before open | $1.62 | $22.28B |
HCA Healthcare (HCA) | Before open | $6.63 | $19.32B |
S&P Global (SPGI) | Before open | $4.42 | $3.64B |
PayPal (PYPL) | Before open | $1.31 | $8.71B |
Visa (V) | After close | $3.44 | $12.09B |
Seagate Technology (STX) | After close | $7.40 | $4.14B |
NXP Semiconductors (NXPI) | After close | $4.12 | $3.76B |
Waste Management (WM) | After close | $2.18 | $6.81B |
Robinhood Markets (HOOD) | After close | $0.55 | $1.43B |
Source: Yahoo Finance consensus estimates, with dates and timing confirmed against Nasdaq and Kiplinger calendars. As of October 26, 2026.
Economy
Economy
Tuesday, October 27, 2026. Day one of the two-day FOMC meeting. All times ET.
Time (ET) | Release (period) | Prior | Consensus | Forecast |
|---|---|---|---|---|
8:30 AM | Durable Goods Orders MoM (Sep) | 0.0% | 1.5% | 1.3% |
8:30 AM | Durable Goods ex Transportation MoM (Sep) | 0.3% | 0.6% | 0.5% |
9:00 AM | S&P/Case-Shiller Home Price Index YoY (Aug) | 2.5% | 2.5% | 2.6% |
10:00 AM | Conference Board Consumer Confidence (Oct) | 81.9 | 81.0 | 80.0 |
10:00 AM | New Home Sales (Sep) | 0.684M | 0.650M | 0.660M |
1:00 PM | 5-Year Treasury Note Auction | 5.033% | n/a | n/a |
Fed speakers: None. The Fed is in its pre-meeting blackout. The FOMC decision lands Wednesday at 2:00 PM ET, with the press conference at 2:30 PM ET.
Source: Trading Economics (primary), confirmed against the Census Bureau, Conference Board and Federal Reserve schedules. As of October 26, 2026.
Market Trading Update
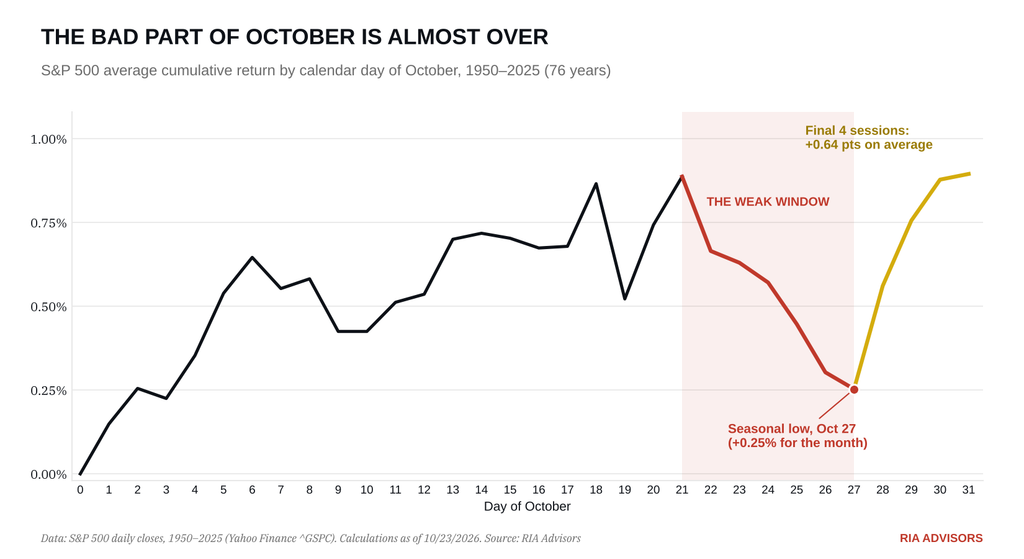
Yesterday, we discussed how the market’s biggest buyer is stepping back, with the S&P 500 resting on its 100-day moving average at 7,605. Today, let’s look at the calendar, because year-end seasonality is about to turn in the bulls’ favor.
As shown below, October 21st through the 27th has been the weakest stretch of the month since 1950. On average, the S&P 500 surrenders about 70% of its October gain in that window, bottoming on the 27th. The final four sessions then recover all of it and a little more. This year followed the script almost to the day. The index slipped 1.7% from the October 21st close of 7,757 to Friday’s 7,623.68.
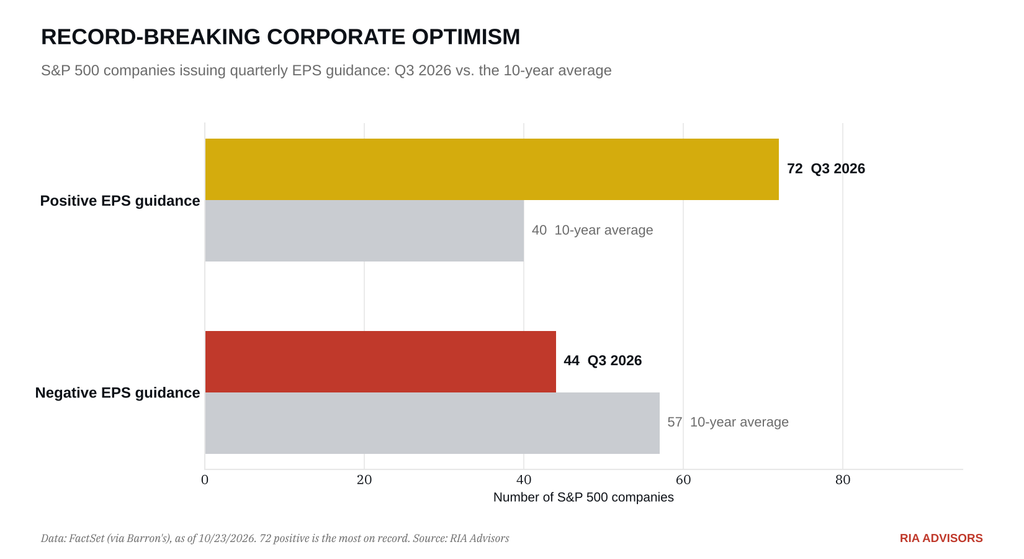
The fundamentals support the seasonal turn. According to FactSet (FDS), 24% of S&P 500 companies have reported, and 83% beat estimates, above the 5-year average of 78%. Blended Q3 earnings growth sits at 29.5%. More telling, a record 72 companies issued positive EPS guidance for the quarter, against a 10-year average of 40. Only 44 guided lower, well below the norm of 57. The catch is the size of the beats. The aggregate surprise is just 2.1% versus a 5-year average of 7.5%, which suggests analysts have finally caught up with reality.
So what happens next? From the October 26th close through December 31st, the S&P 500 has averaged a 3.94% gain since 1950 and finished higher 82% of the time. This year stacks the deck further. 2026 is a midterm year, the index is up 11.4% year-to-date, and October is slightly negative month-to-date. Each of those regimes lifts the average return to between 4.5% and 5.6%. In the nine midterm years with a positive year-to-date gain, the market finished higher every single time.
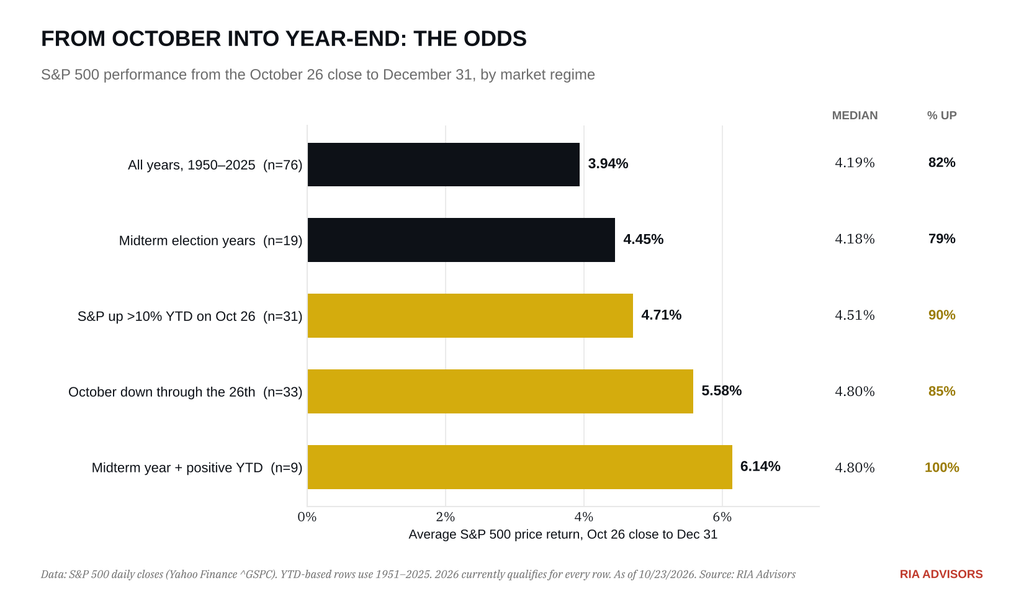
Applied to Friday’s close, the long-run average implies roughly 7,925, above the October 6th record. However, averages are NOT forecasts. The worst outcome came in 1973, a 12.4% decline. The closest analog may be 2018, also a midterm year, when a Fed hiking into rising yields produced a 5.7% loss over the same window. With the FOMC meeting on Wednesday and the 10-year near 5.0%, the risk of over-tightening deserves respect.
Our playbook hasn’t changed. The 100-day average at 7,605 is the line. If it holds through Wednesday’s Fed decision and the Microsoft (MSFT) and Alphabet (GOOGL) reports, we’ll use the seasonal tailwind to rebalance back toward growth. If it breaks, we wait for the September 16th low at 7,564 or the 200-day at 7,293 before adding risk. Keep stops below the 200-day either way.
The calendar won’t save a portfolio that ignores the tape.
Healthcare Is Red Hot: Time For a Change?
The “out-of-technology” rotation is playing out in an interesting way. About a month ago, the technology sector was in the upper-right corner of the graph, with absolute and relative scores in the 80s and low 90s at times. Except for energy, almost every other sector was oversold, with many deeply oversold. In less than four weeks, healthcare is now very overbought, alongside energy, which lingers in overbought territory due to the Iran war. Many interest-rate-sensitive stocks are clustered at fair value. Sitting slightly in oversold territory are technology alongside the more energy-sensitive transportation and industrial stocks.
Healthcare stocks are unique in that they are not overly sensitive to interest rates or economic activity. Thus, with the sell-off in technology, it seems to be the sector investors are most comfortable with. Interest rate-sensitive stocks like utilities, staples, and real estate have improved but seem hesitant to lead the market as rates remain very high and it’s still unclear whether this bond rally has further to go. Similarly, with higher rates and the Fed likely raising rates again Wednesday or in December, investors aren’t gung-ho about economically sensitive stocks. For now, healthcare seems like the safe sector. However, healthcare is very overbought and seemingly ripe for a rotation in the coming weeks.
Will the technology financing concerns continue, pushing the sector into more oversold territory? Might rates keep falling and, in the process, boosting interest rate-sensitive stocks? Lastly, energy is and has been very overbought. It might continue that way until the Iran crisis simmers down. But beware: a durable peace agreement with Iran could likely set energy stocks to underperform and push the sector to the bottom-left corner of the scatter plot.
Griffin May Be Right About AI: The Timing Could Be Very Wrong
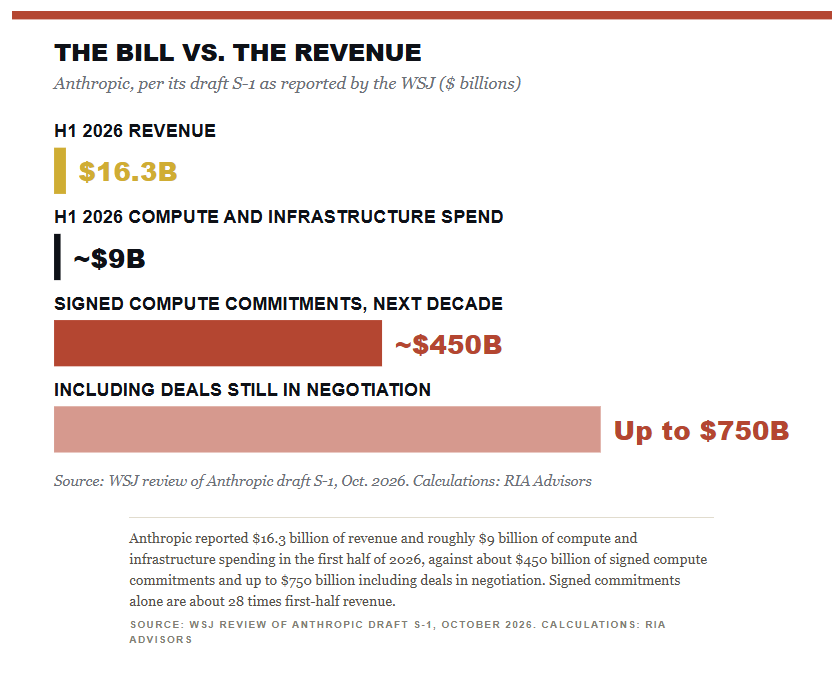
Ken Griffin told a room full of investors recently that we are “almost certainly” in an AI bubble. He may well be correct in that assessment, and there are plenty of media narratives that support that view. However, as always, the problem is that “right” isn’t a trade. Timing the AI bubble is where the money is made or lost, and history is littered with smart people who called a bubble correctly and still cost their clients a fortune by acting on it too soon.
“Being right, and being early, is the same thing as being wrong.” – Howard Marks
Again, I don’t disagree with Griffin’s thinking, and I want to stay entirely neutral in this analysis. Here are the two arguments as they stand currently, and both are likely correct.
The bullish argument is that AI technology is transformational.
The bears argue that the prices being paid for it look stretched.
The question that we want to answer, and the only one that actually matters for your portfolio, is what to do while both are true, possibly for years.
Tweet of the Day



Comments
Log in or sign up to join the conversation.