

Major equity indices essentially went sideways last week, and interest rates firmed up. August fared very well in job creation, and this probably puts the FOMC under pressure to tighten monetary policy, provided of course this Friday’s CPI report plays along.
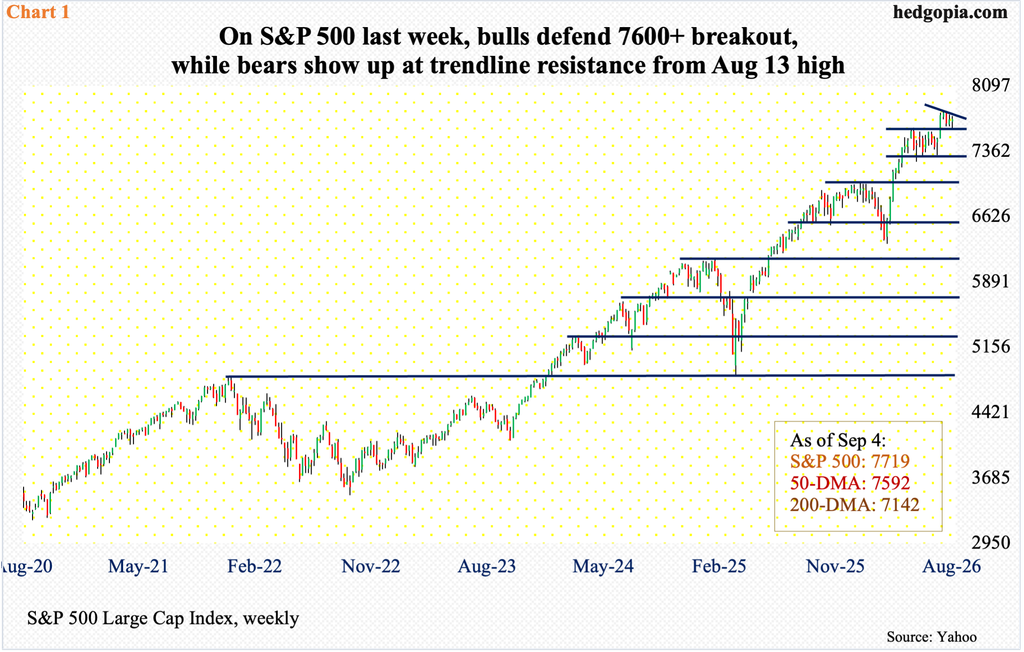
Equity bulls and bears both stood their ground last week. This was particularly evident in the S&P 500. On Tuesday, with an intraday low of 7611, bulls defended breakout retest at 7600-plus; bears, on the other hand, showed up Thursday at trendline resistance from August 13 when the large cap index ticked 7817 and retreated (Chart 1). In the end, it edged up 0.1 percent for the week to 7719, forming a weekly spinning top.
The S&P 500 earlier consolidated for a couple of months after peaking at 7621 on June 2. Through that high, it had jumped 23.7 percent from the March 30 intraday low of 6317. The June high was eclipsed on August 4.
Last week’s was a fifth up week in six, although not a whole lot of progress has been made since the August breakout. The daily Bollinger bands in the meantime have tightened quite a bit. This tends to precede a sharp move up or down. The bands similarly tightened in late July, and this was followed by the afore-mentioned breakout past the early-June high. As things stand, bulls may have a slight edge, but only so far as 7600-plus remains intact.
Last week’s rather aimless trading came in a week in which August’s jobs report was published Friday. This was one of the two datapoints markets were fixated on ahead of next week’s FOMC meeting. The other was August’s consumer price index on schedule for this Friday.
Last month, the economy created a much-better-than-expected 162,000 non-farm jobs. This compared with the consensus 53,000. As well, both June and July were revised up, with July’s previously reported negative 23,000 revised to a positive 21,000. This pushed up the eight-month average this year to 80,000, up from 69,000 for the first seven months.
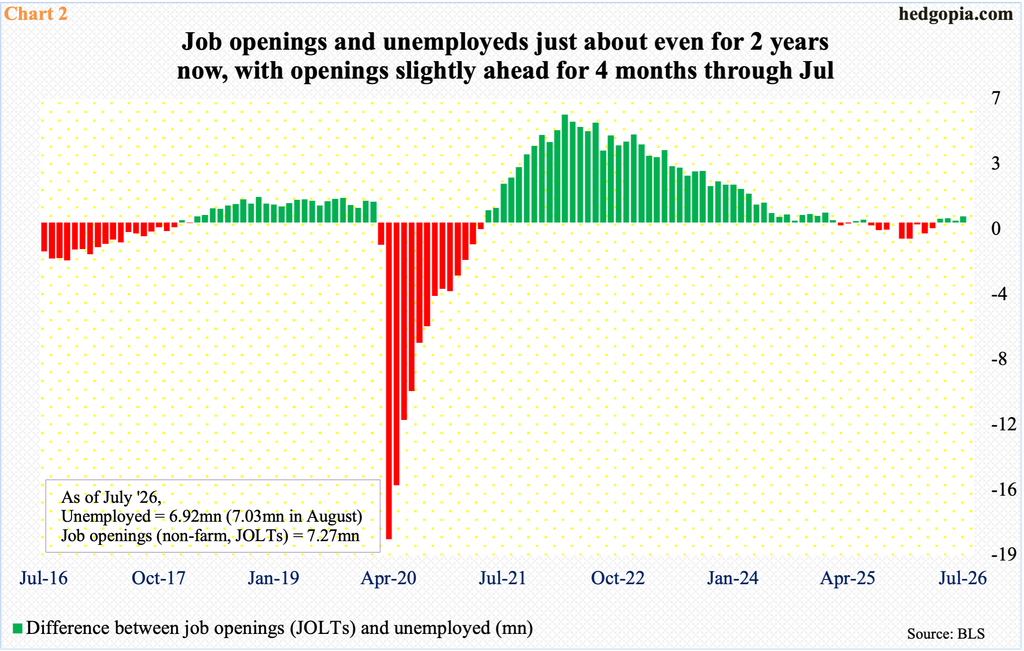
Chart 2 compares the unemployed with non-farm job openings. There were 7.03 million unemployed in August, but the chart uses July’s count of 6.92 million; August’s openings are yet to be reported, and they were 7.27 million in July.
For two years now, job openings and unemployed have been just about even, with the former slightly ahead for four months through July. The job market is not going gangbusters but is doing just fine.
August’s jobs report has given the green light for the FOMC (Federal Open Market Committee) to tighten policy in next week’s meeting. This is just one side of the coin, as the Federal Reserve has a dual mandate of maximum employment and price stability.
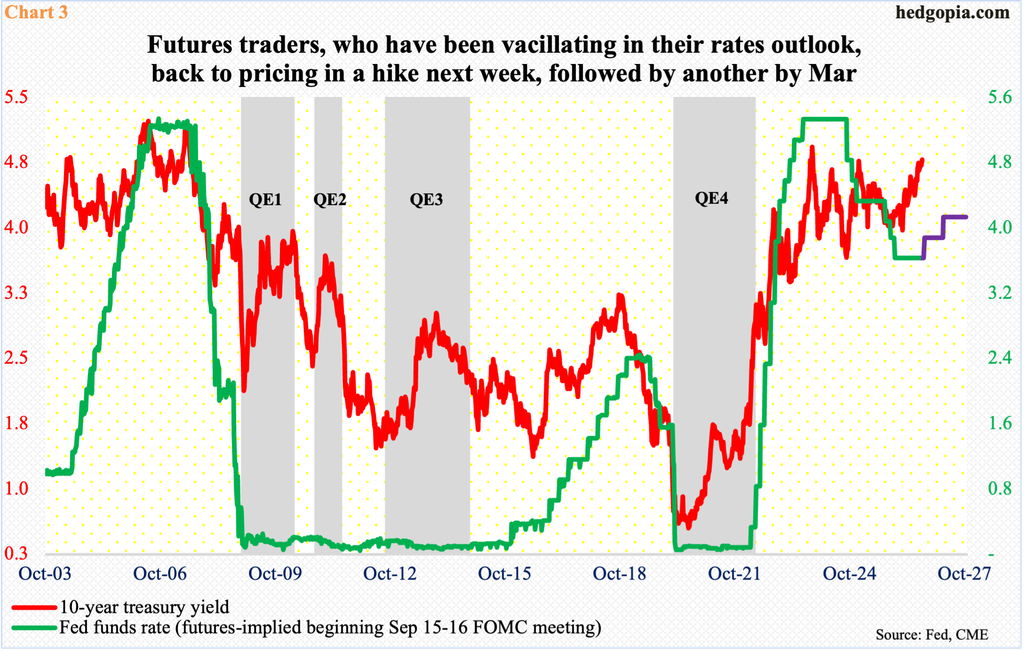
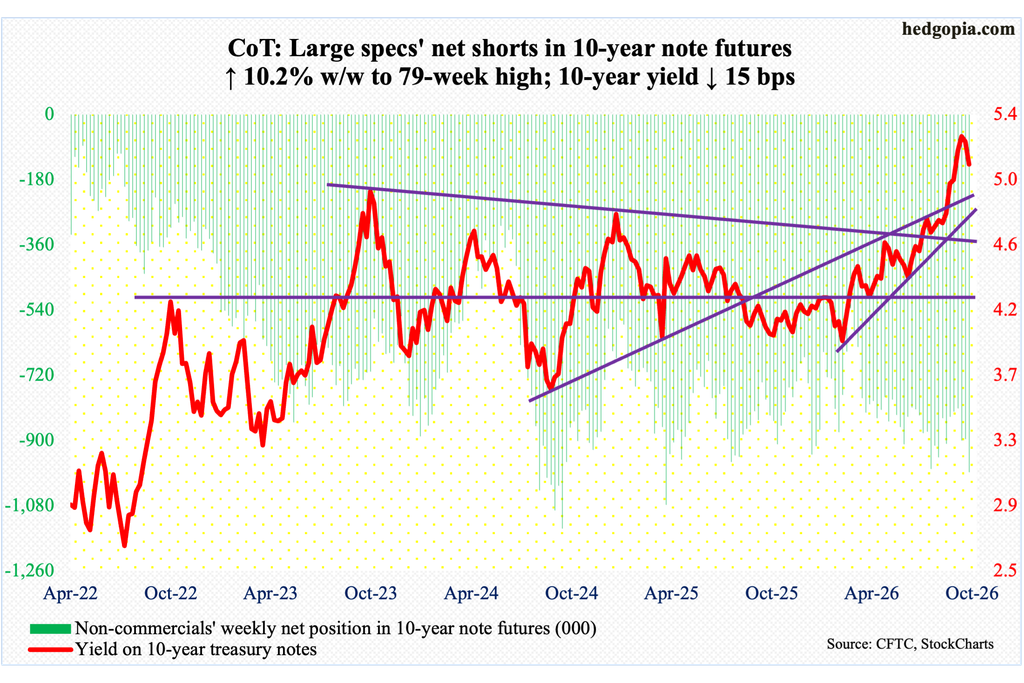
The bond market responded to the jobs report by selling off across the board, meaning yields shifted up across the curve, with the 10-year treasury yield ending the week up six basis points to 4.78 percent (Chart 3), while the two-year rallied a couple of basis points to 4.37 percent. The two-year tends to be the most sensitive to market expectations for monetary policy.
The probabilities for a quarter-point hike in next week’s meeting ended last week at just south of 60 percent, a few percentage points above where they were a week ago. The fed funds rate has been left unchanged at a range of 3.5 percent to 3.75 percent since last December when it was reduced by 25 basis points; this preceded a cut of similar magnitude in September and October. Earlier, rates reached a cycle high 5.25 percent to 5.50 percent in July 2023, followed by cumulative cuts of 100 basis points over three meetings in 2024.
Rates have come down at a time when consumer inflation – both CPI and PCE (personal consumption expenditures) – have remained above the Fed’s stated goal of two percent for over five years.
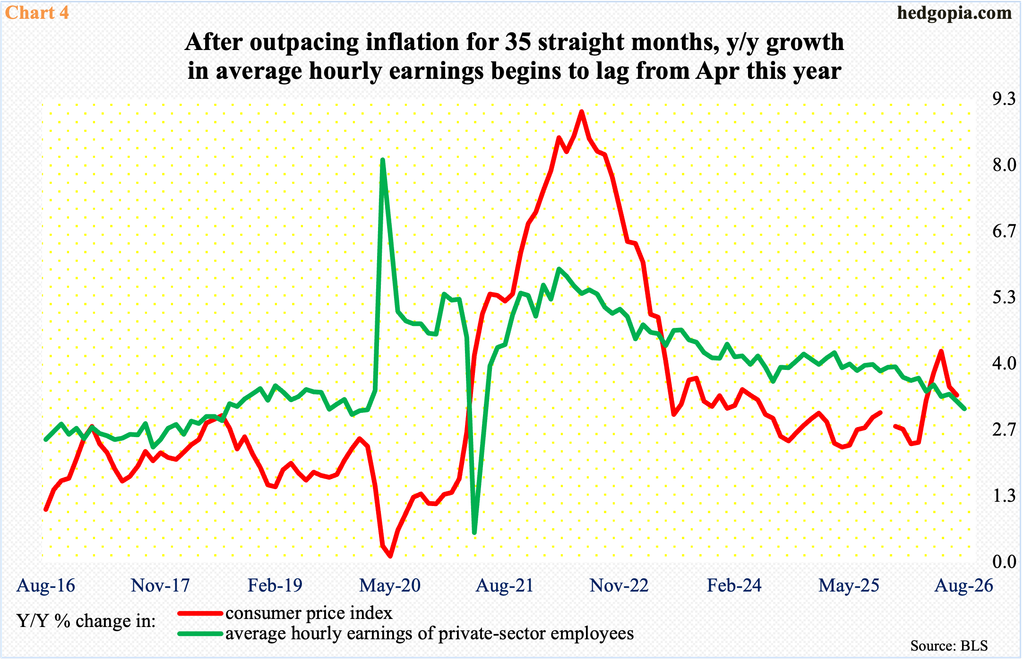
In the 12 months to July, headline and core CPI grew 3.4 percent and 2.5 percent respectively, with May’s 4.3 percent and 2.9 percent at 37- and eight-month highs. Wages are now beginning to lag inflation.
In August, the average hourly earnings of private-sector employees increased 3.1 percent, which was the slowest year-over-year pace in just over five years. After remaining ahead of CPI for 35 straight months, wages have fallen behind since April this year (Chart 4).
Rate worries are being reflected in small-caps, which have a large exposure to the domestic economy versus their mid- to large-cap brethren which also have international exposure. Small-cap companies also tend to be leveraged, with more exposure to the short end of the curve.
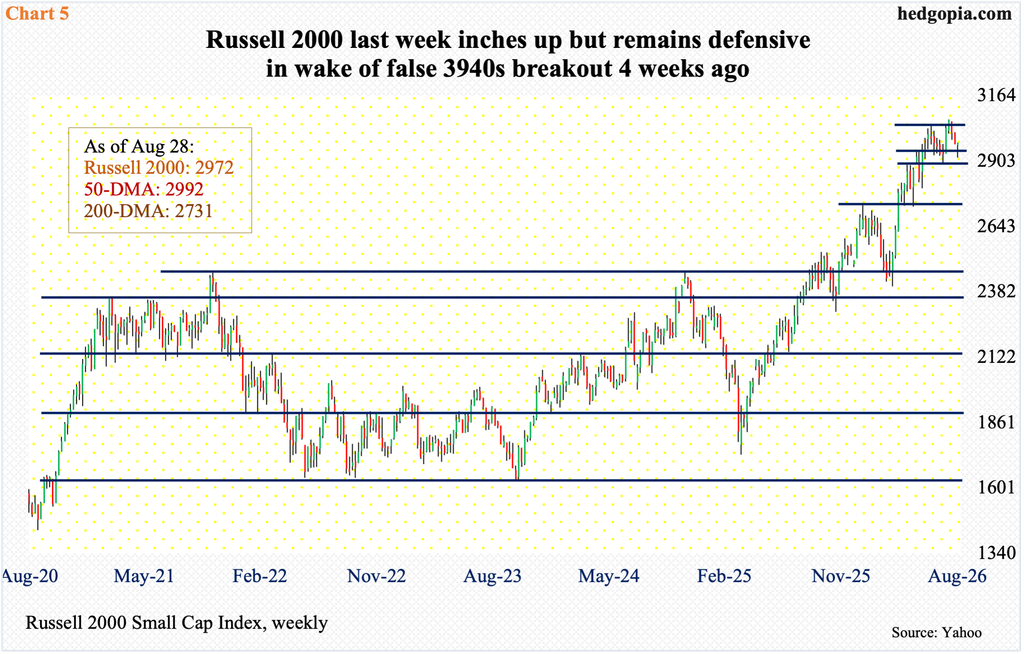
The Russell 2000 last week inched up 0.1 percent to 2976 and remained under the 50-day moving average (2992), which was breached in the week before.
Four weeks ago, small-cap bulls did a great job of breaking out of 3040s but failed to build on it (Chart 5); the index earlier hit 3047 on July 1, 3049 on August 5 and 3049 again on the 18th. Bulls thus far have done a decent job of defending horizontal support at 2940s but can attract selling at the 50-day, which coincides with trendline resistance from August 14 when the index peaked at 3070 on August 14.
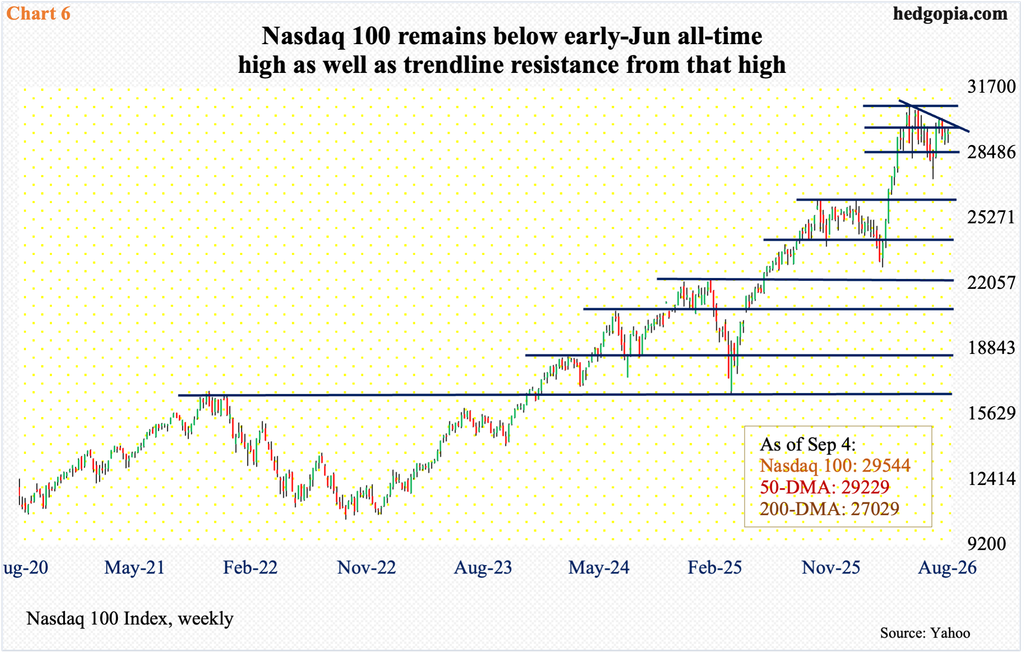
Of the major equity indices, the Nasdaq 100 acts the most defensive. Unlike both the S&P 500 and Russell 2000, which both made fresh highs last month, the tech-heavy index is still smarting under its high from June 3 when it ticked 30762. Since that high, it has been making lower highs, and this resistance will be tested at 30000 (Chart 6). Last week, the index rose 0.4 percent to 29544 – past the 50-day at 29229.
Down below, there is horizontal support at 28800s, followed by 28600s. And, as is the case with the S&P 500, the daily Bollinger bands are narrow on the Nasdaq 100. A big move is coming.

Comments
Log in or sign up to join the conversation.