


Here are 8 charts and tables to discuss.
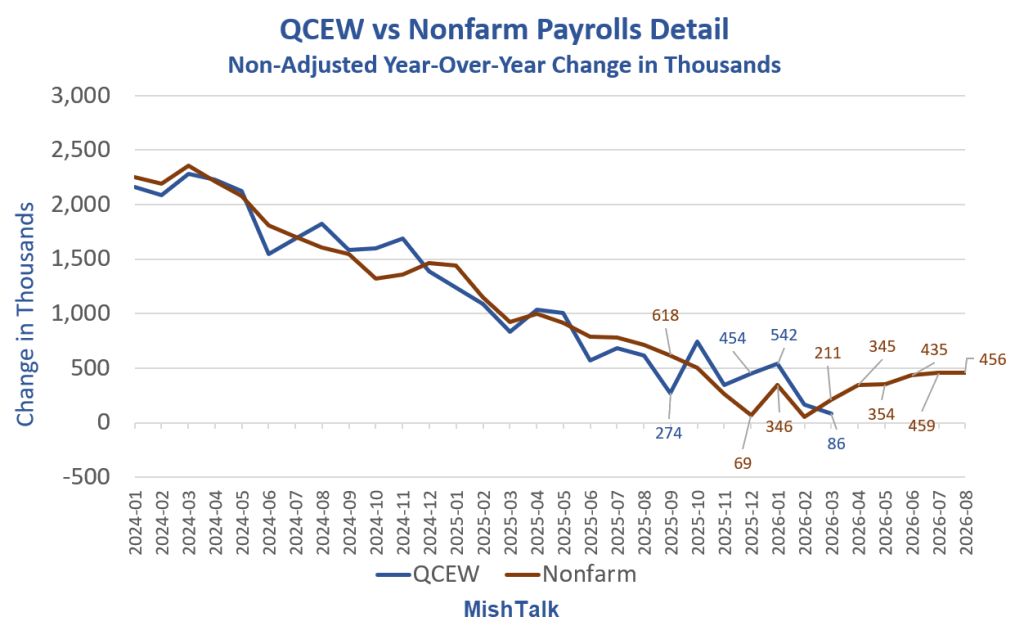
The lead chart compares the Quarterly Census of Employment and Wages (QCEW) to the Current Employment Statistics (CES) nonfarm payroll report.
Quick answer: The recent uptrend in nonfarm payrolls may be a mirage. Year over year through March, the CES payroll survey shows +211,000 jobs against +86,000 in the QCEW. QCEW covers 12.2 million establishments with mandatory responses, while the payroll survey covers about 629,000 with a 43.3 percent response rate.
Year-Over-Year QCEW and CES Nonfarm Payrolls Through March
CES: +211,000 jobs
QCEW+ 86,000 jobs
These numbers are down from over 2 million jobs in January of 2024, and down from over a million jobs in January of 2025.
Two Key Points
The recent uptrend in nonfarm payrolls may be a mirage of sampling and non-sampling errors.
Everything depends on whether the chart reflects a genuine trend change, is an arbitrary bump, or worse yet a mirage that will be revised away.
QCEW vs Nonfarm Payrolls
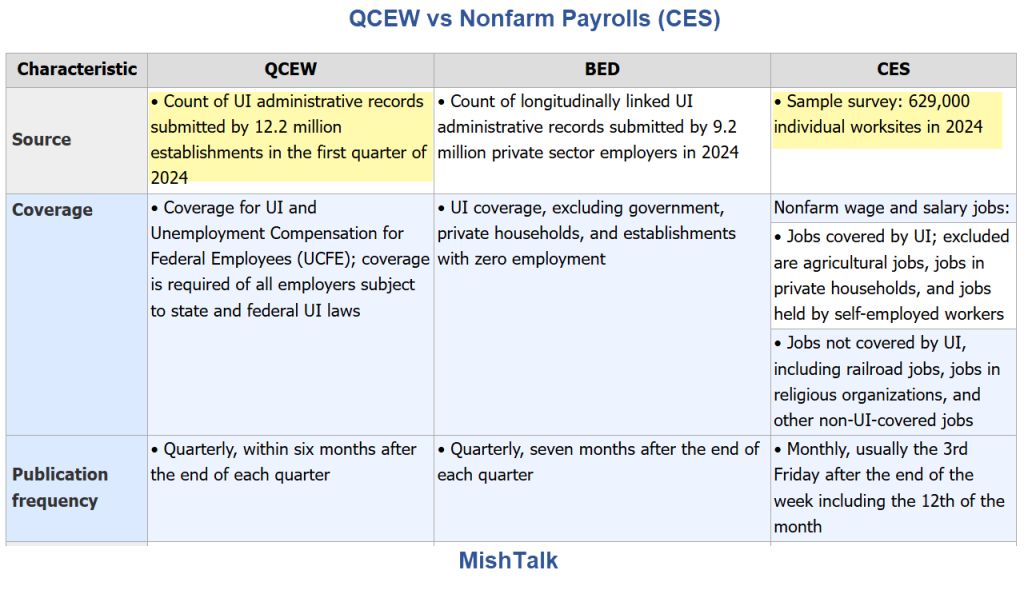
The above image from QCEW Concepts.
The CES survey is 629,000 worksites (with optional reporting) compared to mandatory responses by 12.2 million establishments.
CES Response Rates
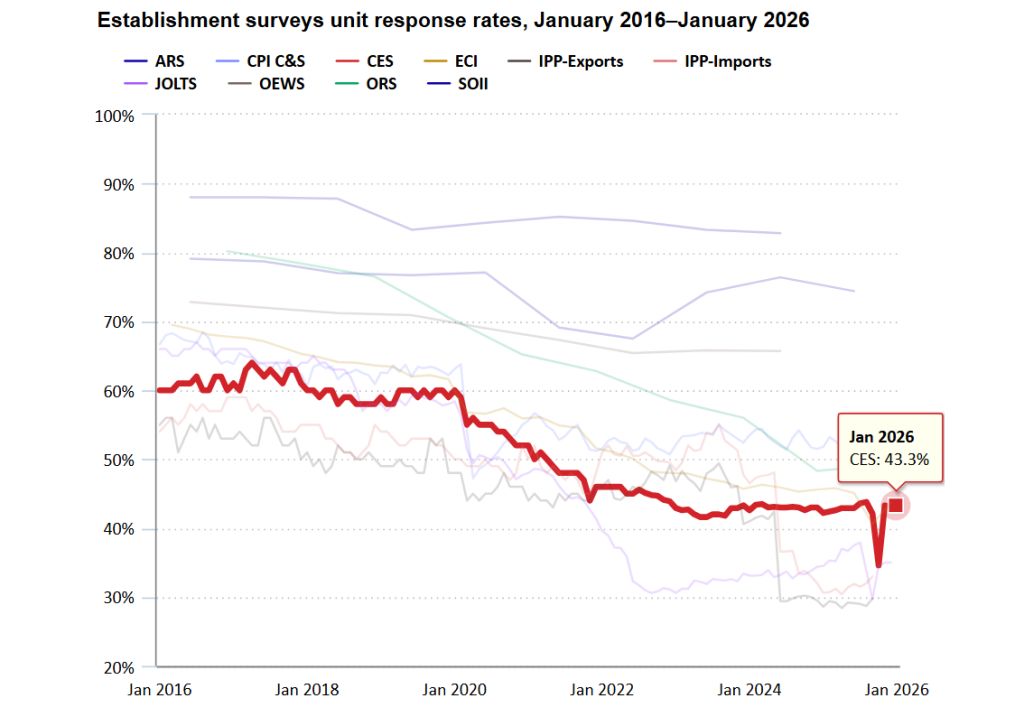
The above image is from BLS Response Rates.
Comparison: QCEW consists of 12.2 million establishments with about 95 percent coverage.
In contrast, the Nonfarm payroll report surveys ~629,000 establishments with a response rate of 43.3 percent as of January 2026.
Discrepancies are inevitable. So, the BLS adjusts CES with annual benchmark revisions.
In July, the BLS released the preliminary revision for March of 2026 compared to March of 2025.
Annual Benchmark Revisions
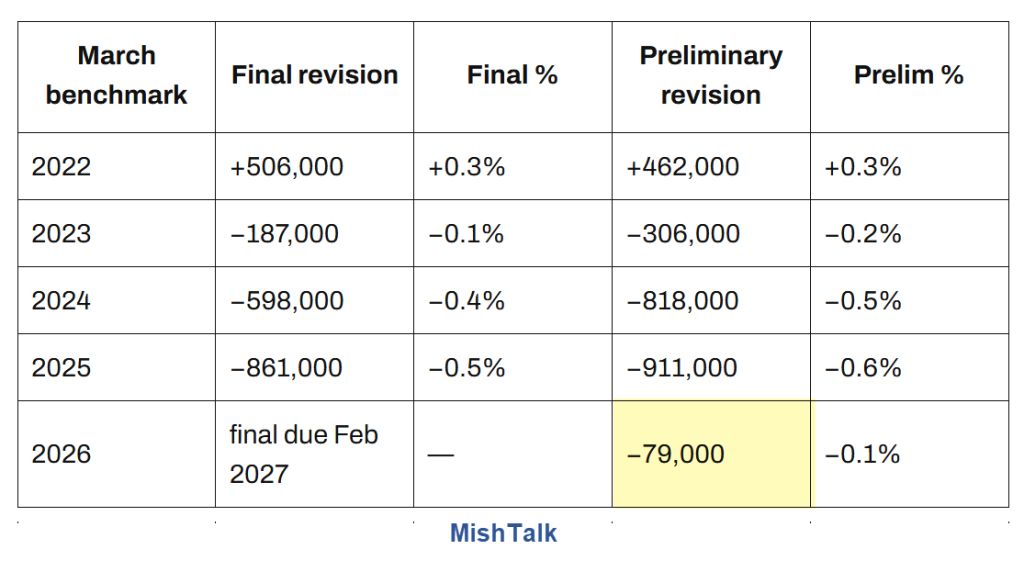
After a series of huge BLS benchmark revisions based on the Quarterly Census of Employment and Wages (QCEW), the latest revision was small.
The BLS reports the Preliminary Benchmark Revision for March of 2026 (from March 2025) is -79,000 total jobs.
The preliminary estimate of the Current Employment Statistics (CES) national benchmark revision to total nonfarm employment for March 2026 was -79,000 (-0.1 percent)
The preliminary benchmark revision for total private employment was -178,000 (-0.1 percent).
Over time, the slope of the QCEW and the slope of CES will match, and that’s what the lead chart shows.
Month-Over-Month Comparisons
To make month-over-month comparisons, one needs seasonally adjusted numbers.
The QCEW should also list seasonal adjustments but it doesn’t.
Lack of month-over-month analysis makes QCEW even less timely.
I do not have a financial package to seasonally adjust QCEW, but I do have permission from John “Jake” Bush at Piper Sandler & Co. to post his seasonally adjusted QCEW data.
However, that data is only through 2024 for a post I did in 2025.
QCEW vs Nonfarm Payrolls Seasonally Adjusted Detail
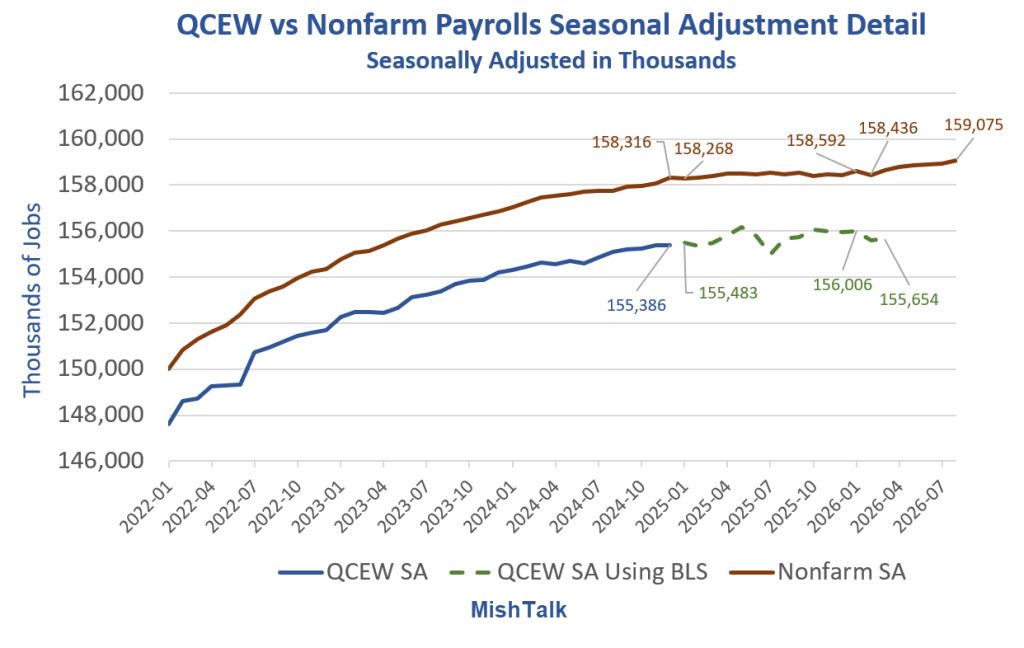
QCEW vs Nonfarm Payrolls Seasonal Adjustment Notes
Blue Line: QCEW SA from “Jake” Bush at Piper Sandler & Co.
Red Line: BLS reported Nonfarm Seasonal Adjustments
Green Line: I used BLS Seasonal Adjustment factors applied to QCEW
I am confident of using the BLS adjustment applied to QCEW, at least as a ballpark estimate. The following chart shows why.
QCEW vs Nonfarm Payroll Seasonal Adjustments
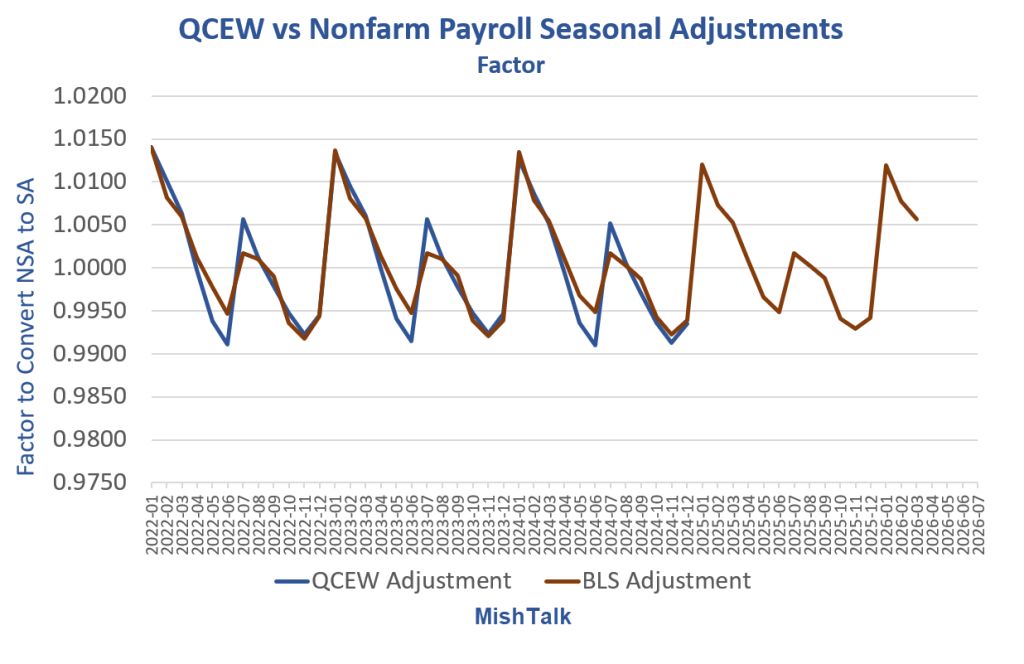
The blue line shows derived factors from Piper data vs derived factors from BLS numbers.
Curiously, QCEW seasonal adjustment factors are very close to BLS seasonal adjustment factors for October through March.
However, there are consistent directional flip-flops April through September.
Since March is inside the relatively safe window, we can make some comparisons.
CES SA | QCEW SA | Gap | |
|---|---|---|---|
Last Piper (Dec 2024) | 158,316 | 155,386 | 2,930 |
Mish (green, Mar 2026) | 158,436 | 155,654 | 2,782 |
Understanding the Gap
Nonfarm payrolls include some railroads and religious organizations that QCEW doesn’t.
QCEW includes some agricultural households that CES drops.
The net result is a constant ~3 million CES to QCEW discrepancy.
The gap itself is not important, it’s the slope of the charts. However, the BLS should modify nonfarm payrolls to eliminate this continual discrepancy.
Recommendations to the BLS
Normalize QCEW to Nonfarm Payroll datasets
Provide seasonally adjusted QCEW numbers
Use actual tax data to augment CES numbers
Are Deportations and Surveys Impacting CES Numbers?
CES is a weighted sample of establishments.
If a firm doesn’t report, the BLS imputes from similar reporters (industry, size, region).
If nonrespondents are weaker than respondents, imputations overstate jobs.
The smaller, newer, and more heavily immigrant dependent firms are more likely to fear responding to any government form.
To the extent points 2 and 3 are happening, the sample over-represents large, old, native-owned reporters, which were more stable in 2025–26.
Also, birth-death adjustments would also miss new immigrant firms and be slow to kill disappearing ones, with the latter much more likely.
Birth-death refers to the birth or death of corporations, not individuals.
That is nonresponse bias. Collection rates did collapse after Covid. And this remains a real CES issue.
Given poor response rates, the key question is who is it that isn’t responding? If it is firms leaning more heavily on immigrants, then the BLS is overweighting the rest.
Channel | Hits CES? | Hits QCEW? | Verdict |
|---|---|---|---|
Fewer immigrant workers | Lower payrolls | Yes, Same | Real |
Fear, no-show, slower sites | Lower payrolls | Yes, Same | Real |
Lower CES response at immigrant-heavy firms | Imputation from healthier reporters makes CES too high until benchmark | No | Plausible. Unmeasured with a lag |
Birth-death missing deaths / extra births | CES too high until benchmark | No | Measured with a lag |
Deportations and outflows reduce actual payrolls and should show in both CES and QCEW.
QCEW lags by four to seven months, four immediately after a QCEW release (5 to 8 actually because nonfarm payrolls lag by a month).
It’s September, and the latest QCEW data is March.
The risk is that the CES sample leans on firms that still file the survey, which may over-represent the stable part of the universe.
I suspect this is happening, but there is no way to prove it, now. Proof comes later.
The Business Employment Dynamics (BED) report will catch birth-death sampling and non-sampling errors but with an even bigger lag.
Report | Reference Period | Scheduled Release Date & Time | Official Source Tracking |
|---|---|---|---|
BED (Business Employment Dynamics) | First Quarter 2026 | October 28, 2026 at 10:00 AM ET | |
QCEW (Quarterly Census of Employment and Wages) | Second Quarter 2026 | December 2, 2026 at 10:00 AM ET |
I am skeptical there is a sustained trend change in nonfarm payrolls.
Unfortunately, BLS methods are such that we will not know until December, what really happened in June.
The Business Employment Dynamics (BED) report on which the infamous BLS Birth-Death model is based lags even further.
On October 28, we will find out how accurate the Birth-Death model was in March. And that lag is as good as it gets for BED.
Meanwhile, the BLS is using stale Birth-Death models for every monthly nonfarm payroll report.
Lather-Rinse-Repeat with Annual Adjustments. Lovely.
But hey, look on the bright side. We now know with good accuracy what actually happened in March.
And in December we will understand June.
Related Posts
September 4, 2026: Unexpectedly Strong Jobs Report, Payrolls Rise by 162,000 in August
Jobs Rebounded in August, Unemployment Rate Steady at 4.1 Percent.
September 7, 2026: Hello Farmers, Diesel New Record Near $6, Labor Day Gasoline Record Too
A week ago we were looking for $5.80 Diesel, now $6.00 is in sight.
September 8, 2026: Seven Forces Support High and Rising Bond Yields
There are national and international forces pressuring yields.


Comments
Log in or sign up to join the conversation.