
Alan Greenspan, the Federal Reserve chairman from 1987 to 2006, died on Monday at the age of 100. Most of the media’s obituaries are flattering to Greenspan, but many seem to omit his most enduring contribution to financial markets and investors. Simply, when markets are at significant risk or breaking down, the Fed will step in. In market lingo, this is known as the “Fed Put.” This belief, which has instilled a sense of fearlessness in some investors, remains deeply ingrained in many investors’ mindsets and is as powerful today as it ever was.
The Fed Put was introduced with the failure of Long-Term Capital Management (LTCM) in 1998. LTCM was a hedge fund run by Nobel laureates that nearly took down the global financial system through massive leverage. LTCM’s bets threatened not only the hedge fund but also some large banks and potentially the stock and bond markets. Greenspan helped orchestrate a private-sector bailout, cut rates by 75 bps in six weeks, and assured Wall Street that the Fed would supply as much liquidity as needed to restore calm. It worked. The lesson the market took from that episode was not “leverage kills.” It was the birth of the “too big to fail” mantra.
That lesson has been applied in every market and financial crisis since. From the dot-com bust in 2000 to the Financial Crisis in 2008 and COVID in 2020, the Fed stepped in with overwhelming force. Greenspan’s logic built what we believe is his biggest legacy in today’s markets. It is the assumption that the Fed is always the buyer of last resort.

What To Watch Today
Earnings

Economy

Market Trading Update
Yesterday, we discussed the risk of a market correction given the high level of complacency, market breadth (or lack thereof), and passive flows. Yesterday morning, the market cracked in the one area that was most obvious: semiconductors. While that sell-off in semiconductors was not unexpected, at least some of it was driven by anticipation of tonight’s earnings release. Micron reports fiscal third-quarter earnings tonight after the close, and it’s the most important print of the week. Here’s what Wall Street is looking for, and why the reaction is going to matter well beyond a single stock.
The bar is high. Consensus calls for adjusted earnings near $20.60 a share on revenue around $35 billion. To put that in context, Micron earned $1.91 a share a year ago on $9.3 billion in sales. We’re talking about a roughly tenfold jump in profit and nearly a threefold increase in revenue in twelve months. That’s the AI memory boom in one line.
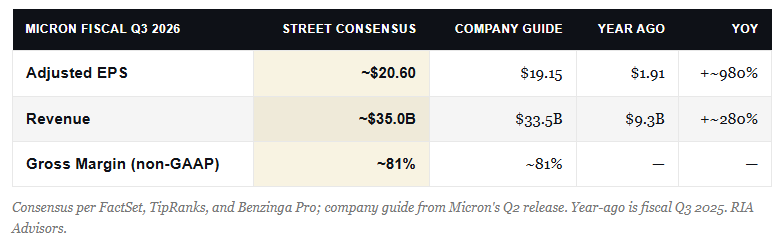
Notice that the Street already sits above Micron’s own guidance of $19.15 and $33.5 billion. Analysts aren’t modeling a quarter that merely matches guidance. They’re modeling a beat, and the whisper number runs higher still.
Here’s the problem with a stock priced this richly. The risk in the print isn’t symmetric.
Start with the miss. Micron has the cleanest read on AI memory demand and pricing in the market. A weak number, or more likely a cautious guide on DRAM and NAND pricing, doesn’t just hit MU. It reads straight through to Nvidia, the high-bandwidth memory names, and every chip ETF that’s carried this rally. Semiconductors have done a wildly disproportionate share of the heavy lifting for the index this year. A memory disappointment tonight becomes a market problem tomorrow, not just a Micron problem.
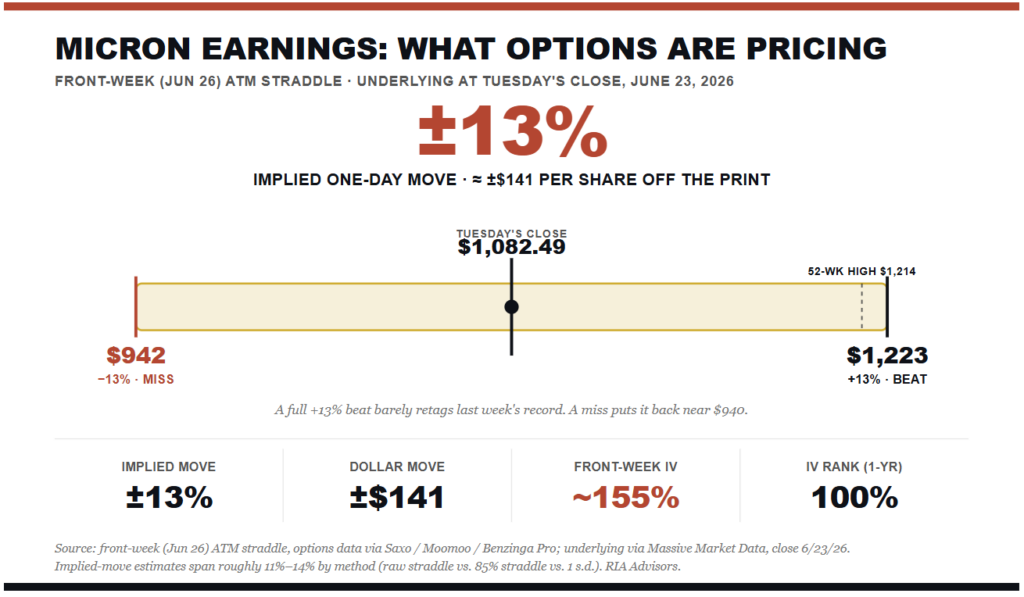
Now the beat, and this is the part investors keep forgetting. A good number may not be good enough. The stock ran to a record $1,213 last week. Consensus already sits above the guide. The options market is pricing in a one-day swing of about 13% in either direction.
When expectations are stacked that high, Micron can beat the number and still sell off the moment management hedges a single sentence about pricing or capacity. We watched exactly that with Broadcom three weeks ago. Solid quarter, cautious guide, and the whole complex got taken to the woodshed.
Which brings us to yesterday’s tape. The selling was concentrated in the semiconductor space. The S&P 500? It was down, but many stocks outside of semiconductors did well as money rotated toward safety to derisk. Notably, when the chip complex gets hit five to ten times harder than the broad market, that’s not a macro story. That looks like investors pulling risk out of semiconductors specifically, ahead of a binary event they can’t handicap.
Make no mistake, some of Tuesday’s weakness traced back to overnight selling in Korean memory names. But the size of the move in US semis, into the close, the day before the bellwether reports, has the fingerprints of position squaring all over it. Traders took chips off the table rather than carry the risk of the number. Watch the guidance, not just the headline. The HBM commentary, the DRAM and NAND pricing language, and the fiscal Q4 outlook will move this stock, and the complex around it, far more than whether EPS prints $20.60 or $21.
The risk of disappointment is likely higher than not, so manage your risk accordingly.
Can We Trust Beta?
A stock’s beta measures how much a stock’s price or a portfolio’s value tends to swing relative to overall market movements. Frequently, investors use Beta to assess the risk of a stock or a portfolio of stocks. For instance, they may reduce beta when they think the market is peaking or add beta when they think it’s troughing. While beta is very useful, it can also be very misleading. Let’s explain.
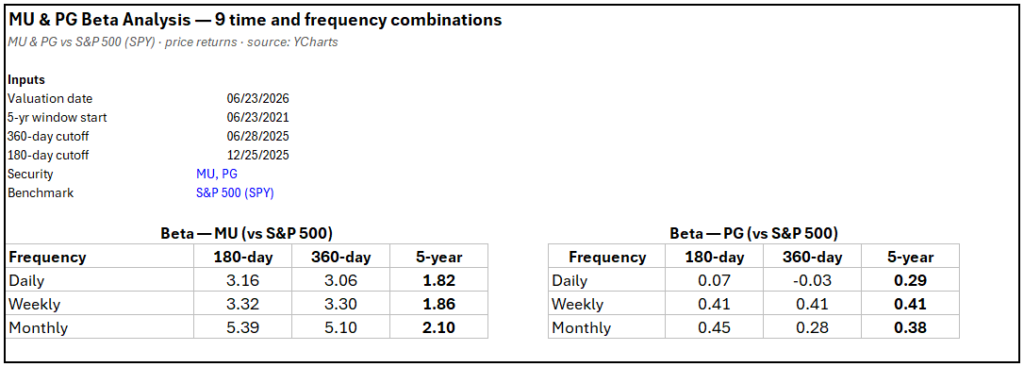
Beta can be measured using daily, weekly, or monthly pricing. Furthermore, it can be measured over short, medium, or long-term horizons. To show how it can produce divergent results, we examine the betas of Micron (MU) and P&G (PG) across three price frequencies and three time horizons. As the tables below show, Micron has a beta ranging from 1.82 to 5.39 depending on the time frame and frequency. While beta is correctly telling us Micron is likely to be more volatile than the market, it is not great at helping us appreciate how much more volatile. PG has a more stable beta, but it too varies. Does it have a slightly negative beta as the daily/1yr shows, or is it roughly in the lower .40s?
The point of this exercise is to show that, when using beta, we should look at it through different time and frequency lenses to capture a range of potential betas. Moreover, consider that new factors may cause the stock or portfolio to react differently to the market than it has in the past, which, to some degree, negates the historical beta readings.
Tweet of the Day


Comments
Log in or sign up to join the conversation.