


The S&P 500 Utilities sector had its best day since April 30th yesterday, rallying 2.29%. All 31 constituents finished higher, giving the sector a perfect breadth day. The gain instantly took the sector from trading 0.21 standard deviations above its 50-DMA to the most overbought sector in the S&P 500, 1.49 standard deviations above its 50-DMA.
Over the last five years, the Utilities sector has recorded 24 days when it rallied 2%+ with perfect breadth. Most were concentrated in the first half of the chart below, while only four have occurred since the start of 2024. Yesterday’s 2.29% rally was also smaller than the average gain of 3.44% on these days since 1990. The largest came on 10/13/08, when the sector soared 13.52% for its biggest one-day gain since at least 1990.
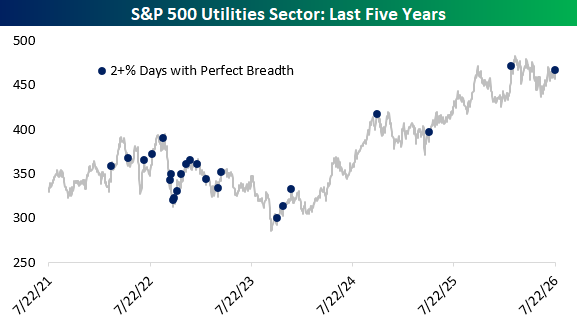
As this has become an increasingly rare occurrence for Utilities, yesterday was just the sector’s third perfect breadth day this year. It’s the second most of any sector this year, yet still below Energy with 5 perfect breadth days. Energy (+31.9%) is currently the top-performing sector of 2026, while Utilities (+7.6%) is the seventh-best, in the bottom half.
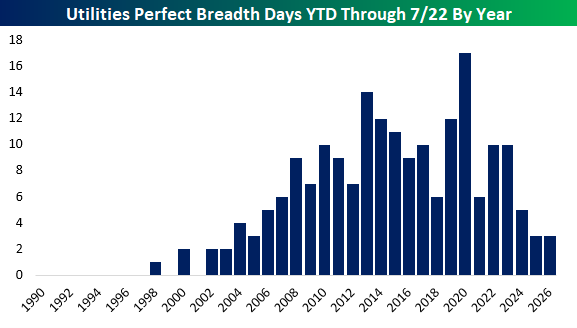
Three perfect breadth days through July 22nd is historically low for Utilities. The sector also recorded three through the same point last year, but before that, no year had so few since 2005. The total reached 17 in 2020, while the average since 1990 is five through this point in the year.
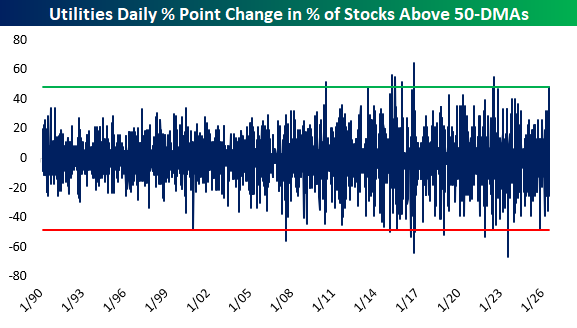
Utilities also saw an unusually large expansion in the percentage of stocks above their 50-DMAs yesterday. That reading nearly doubled from 48.4% to 96.8%, an increase of 48.4 percentage points. Since 1990, only eight other days have produced an increase that large, all occurring since 2010. Moves of similar magnitude in the opposite direction have been nearly as rare, with only eleven days clocking a larger one-day decline.
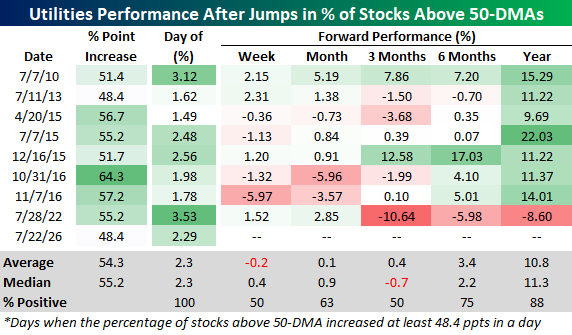
As detailed in the table below, prior jumps of at least 48.4 percentage points in the share of Utilities stocks above their 50-DMAs haven’t provided much of an immediate tailwind. The sector averaged a decline of 0.2% over the next week and was higher only half the time three months later. Longer-term performance was more consistent, however, with the sector gaining an average of 3.4% over the next six months and 10.8% over the next year. The sector was also higher one year later following seven of the eight prior occurrences.


Comments
Log in or sign up to join the conversation.