


In this technical article, we’re going to look at the Elliott Wave charts of the GOLD commodity. GOLD is showing incomplete bearish sequences in the daily cycle, and we have been calling for a decline in the commodity. As expected, the correction unfolded in a clear three-wave structure before sellers stepped back in. In this discussion, we will break down the Elliott Wave forecast.
GOLD Elliott Wave 1 Hour Chart 07.03.2026
The current view suggests that GOLD is forming a recovery against the 4385.35 peak. The price structure indicates that another short-term high could still develop to complete the correction before the next leg lower begins.
The 4385.35 level remains the key pivot, and as long as the price stays below this area, the proposed bearish view remains valid.
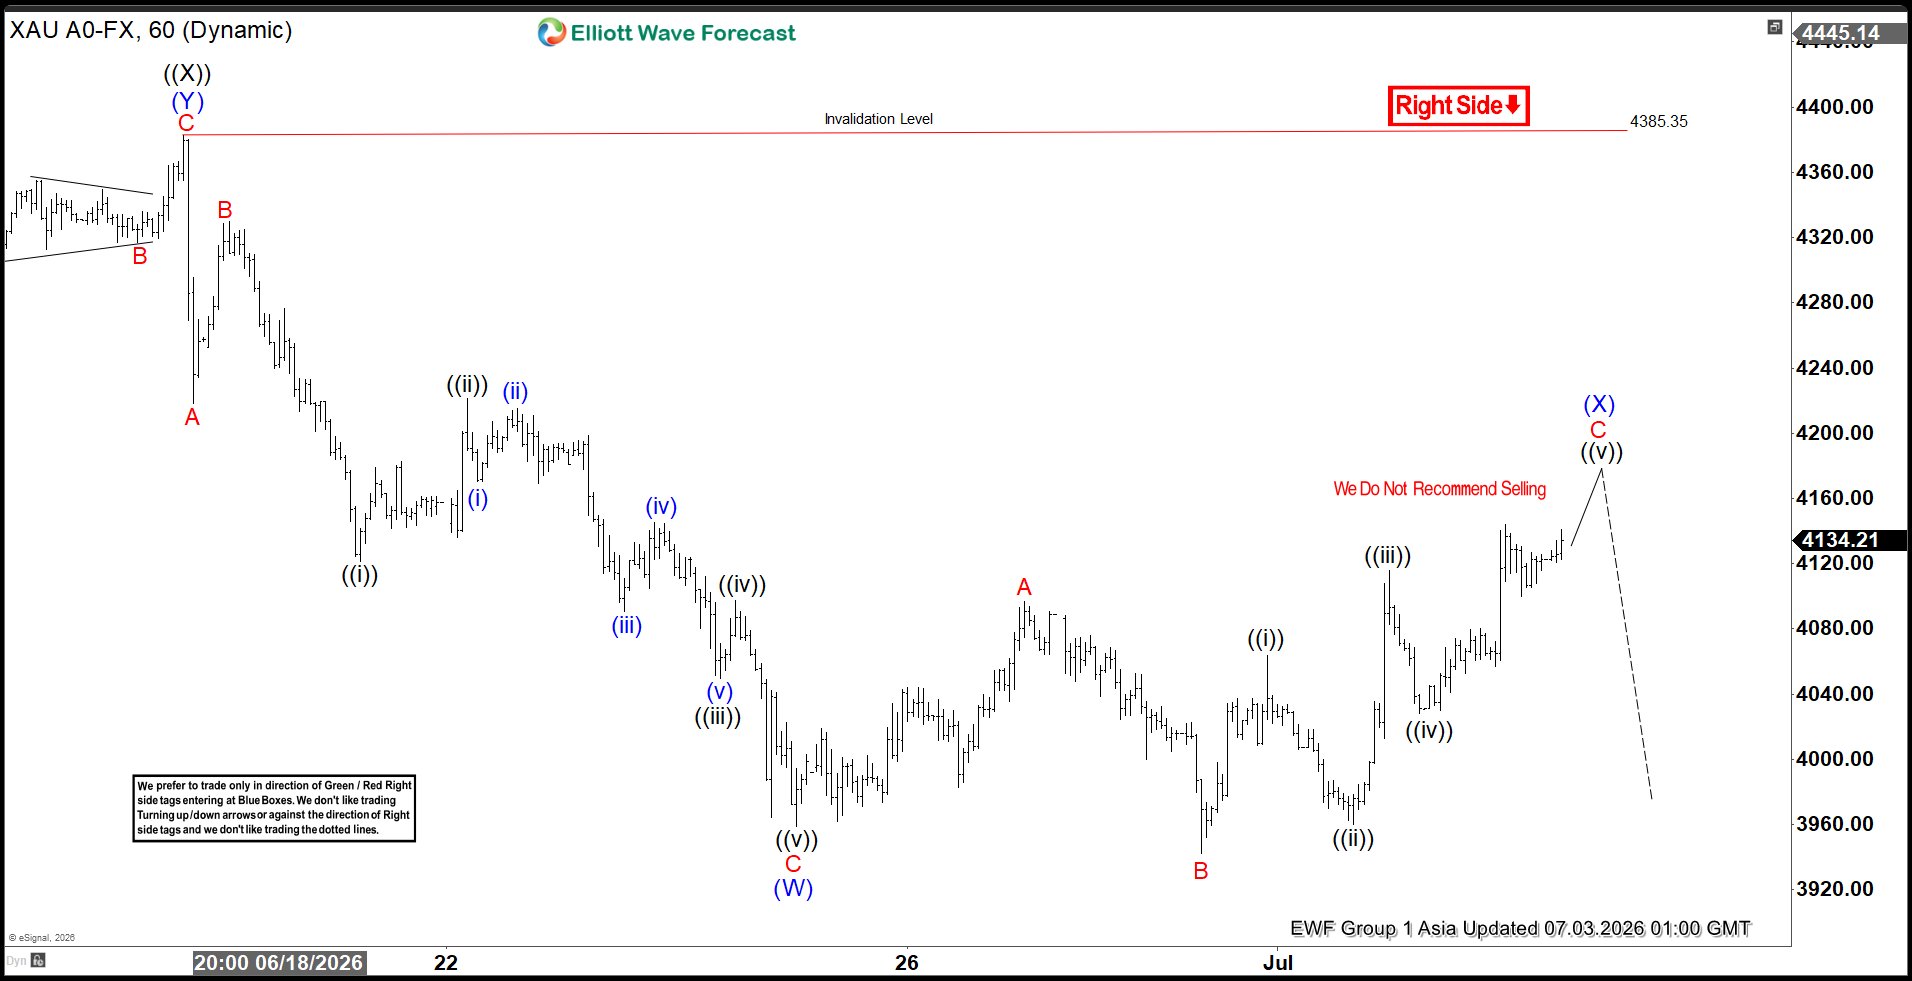
GOLD Elliott Wave 1 Hour Chart 07.03.2026
The commodity has reached another short-term high and completed the wave (B) recovery at the 4201 peak. From there, the price has started to show signs of weakness. As long as the commodity remains below this key resistance level, we expect the downside pressure to persist and would like to see further weakness before a larger recovery can take place.
A break below the wave (B) blue low would provide additional confirmation that the bearish sequence is unfolding and that the next leg lower is underway.
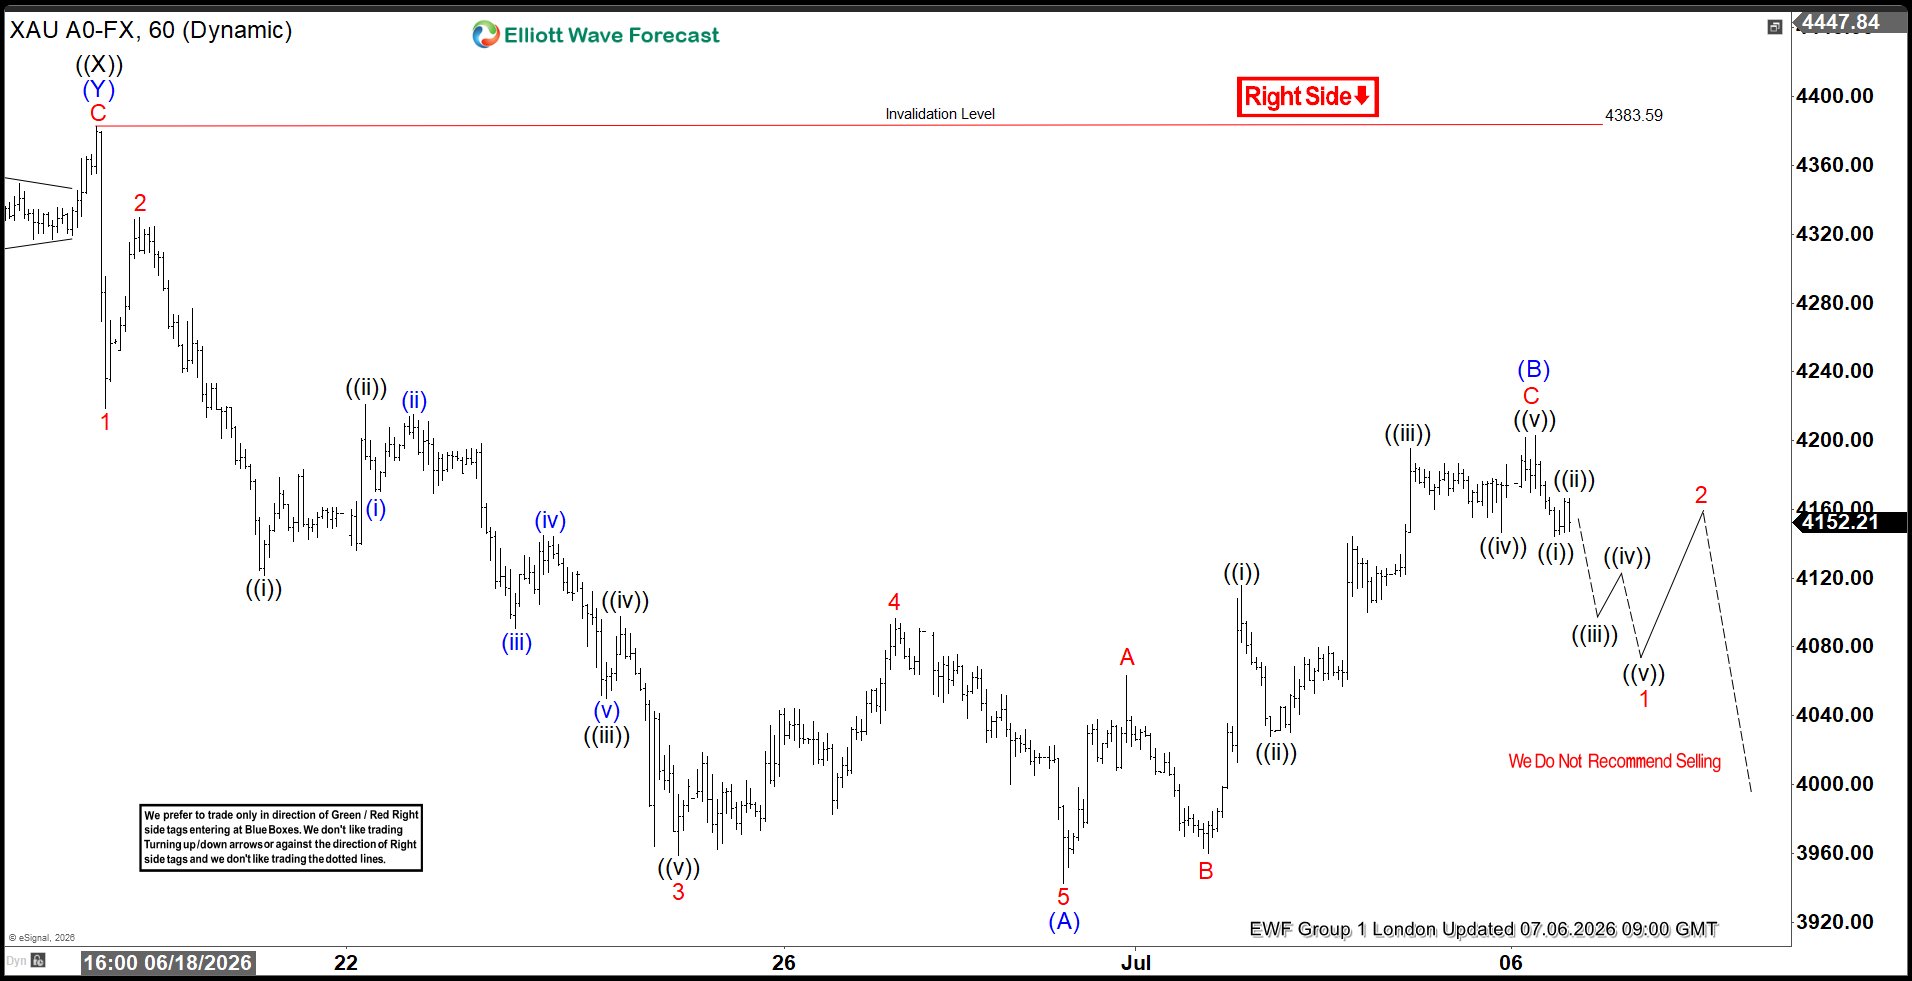



Comments
Log in or sign up to join the conversation.