


Western mainstream media’s narrative for gold is on life support. The story told is that massive debt doesn’t matter, another bungled war doesn’t matter, and a collapsing SPR doesn’t matter.
The narrators say all that matters for gold is that America’s biggest fiat money soup kitchen (the Fed) might raise rates a quarter point, and that’s incredibly negative for gold.
This childish narrative has terrified and demoralized amateur gold investors and leveraged funds… so they aggressively sold gold, silver, and miners into the recent $4100-$3900 buy zone lows.
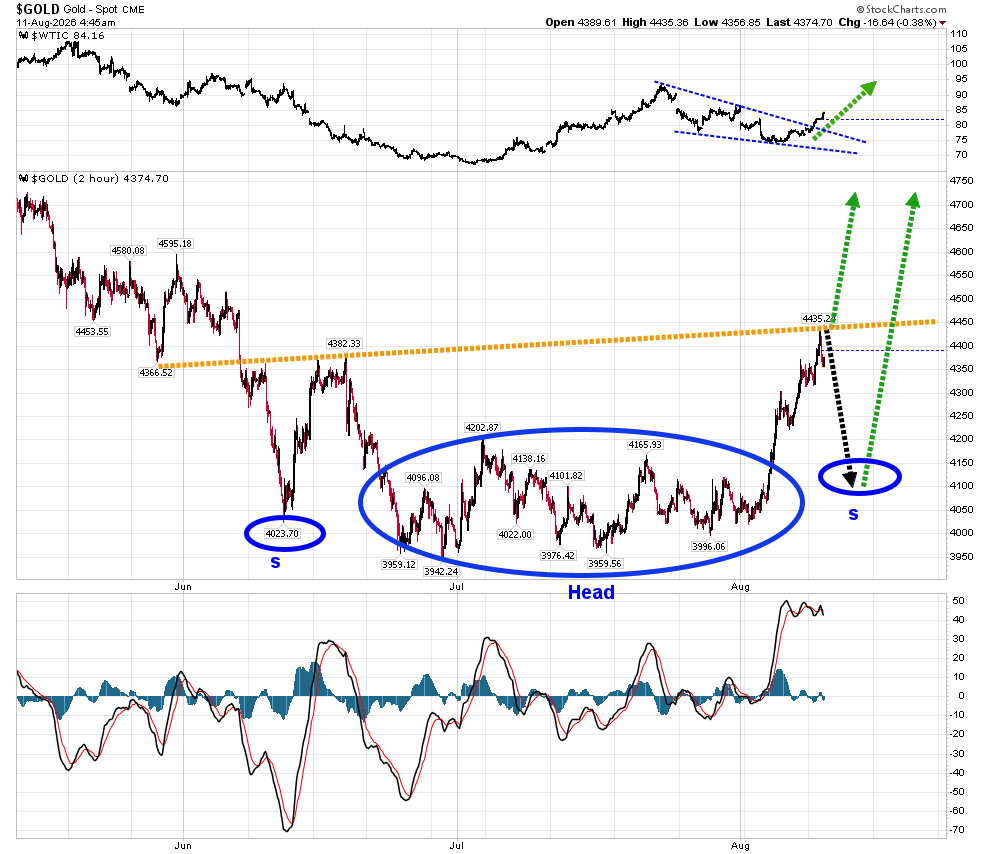
Oil surged $4/BBL yesterday… and gold surged too.
Note the bull wedge breakout for oil, and the substantial base pattern for gold.
The US government is running out of debt-funded missile interceptors for their bungled war in Iran, and stock market investors (price chasers?) are continuously told that a markets-enhancing “deal” is imminent, with US forces in “total control” of Hormuz.
If they are in total control, why are tanker transits near zero… and why is gold beginning to rise alongside oil?
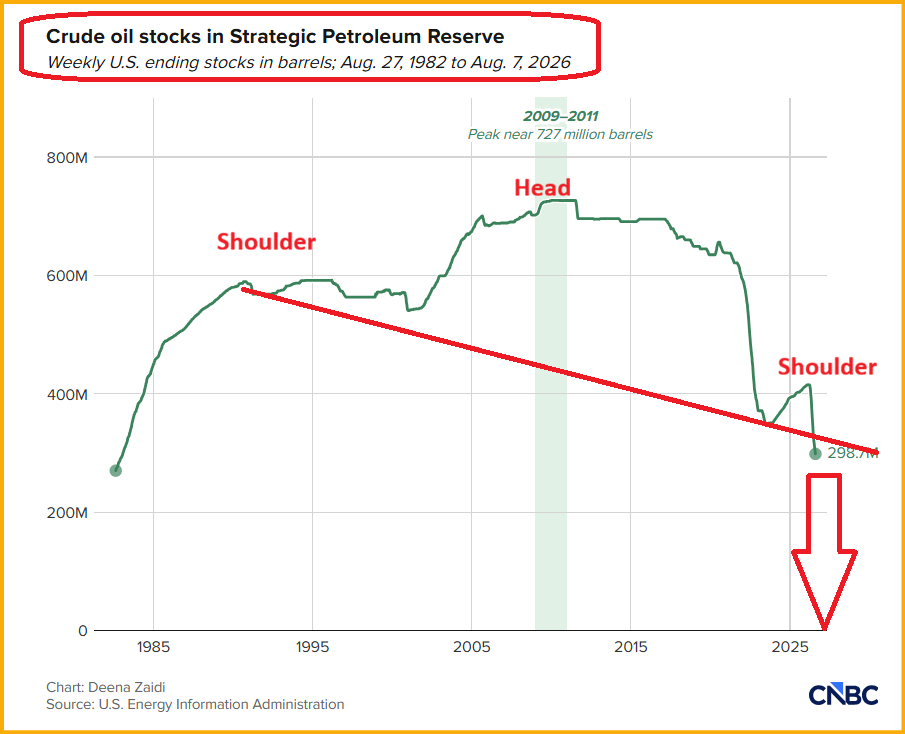
SPR “chart of horror”
Some key investor considerations: The debt really is a problem, and the oil shortage can’t be fixed with rate hikes and deals.
It’s taking a lot more time than silly government officials expected for thousands of new missile interceptors to be built and loaded onto the Navy’s ships. The bottom line:
Savvy citizens should ignore the Western media narrators and get heavily invested in gold.
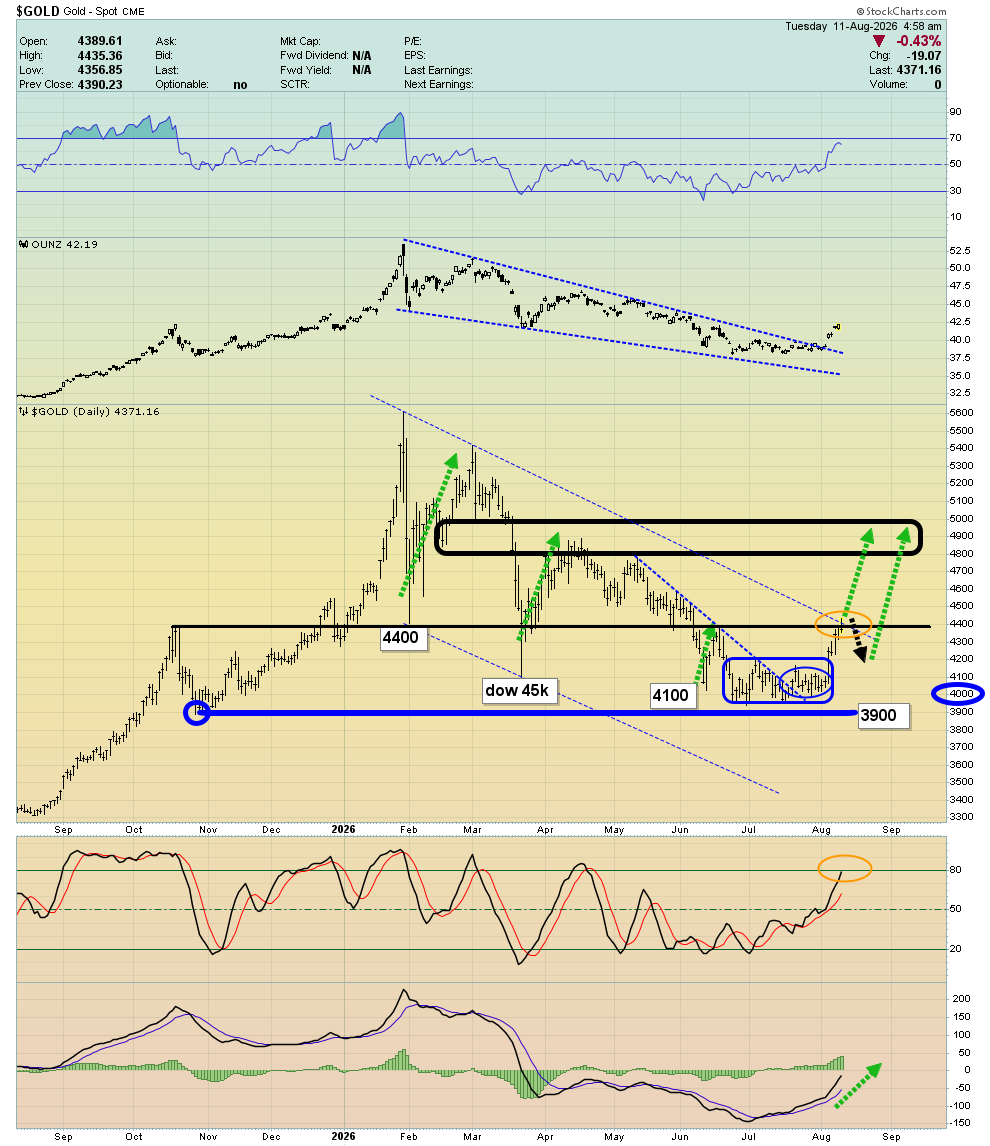
daily chart
Gold has arrived at both horizontal and trendline resistance in the $4400 zone.
Stochastics is also becoming overbought.
At the same time, the CPI and PPI inflation reports are set for release tomorrow and Thursday.
A myriad of gold stocks are up 20%-50% from my key buy zone at $4100-$3900. In a nutshell, it’s time to book partial profits… while holding core positions with an iron hand.
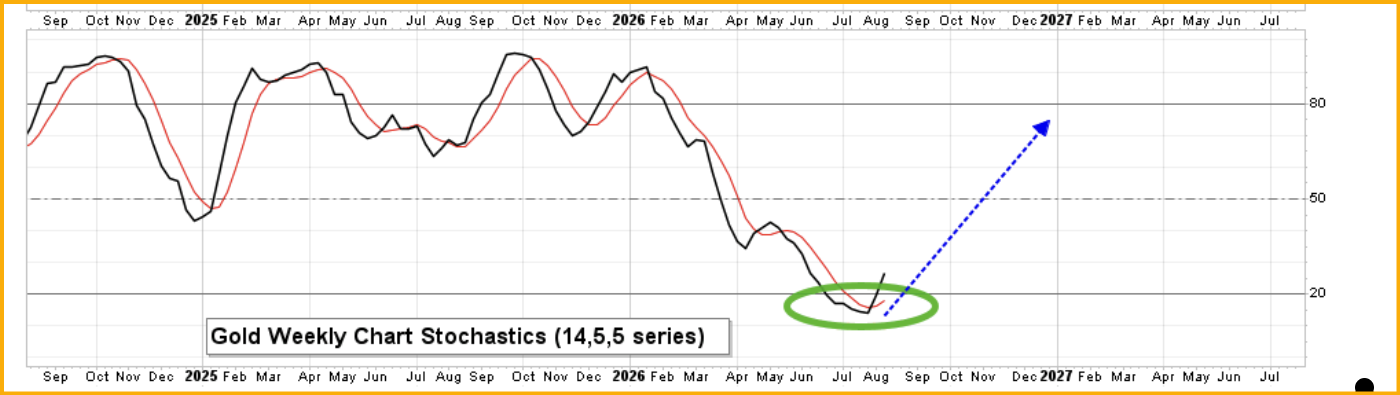
This is an isolated view of the key weekly chart 14,5,5 series Stochastics oscillator.
For gold, it’s arguably the greatest technical indicator of them all.
Clearly, there’s room for Stochastics to surge (along with the price). The target zone of the short-term base pattern is the big resistance zone at $4900-$5000. Silver bullion and mining stock enthusiasts who acted at my $4100-$3900 buy zone can plan on doing more profit booking there.
Next,
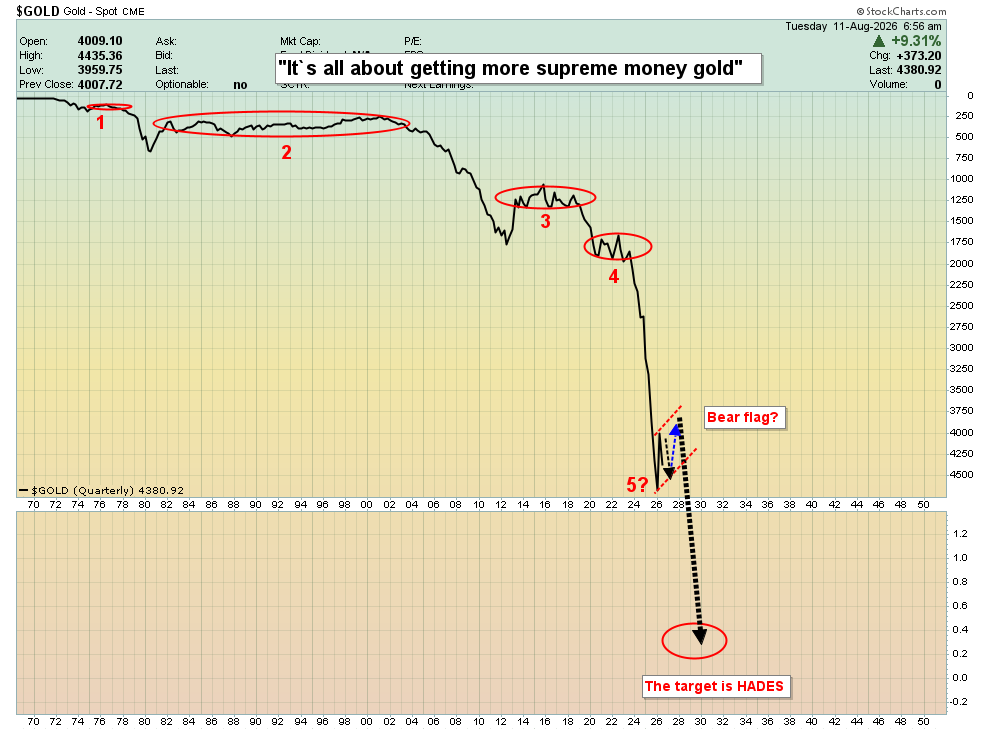
While silver and the miners can be “traded” to make nice fiat profits, gold is by far the world’s greatest currency. Unless there’s a dire emergency, selling gold for floundering fiat is an act of madness.
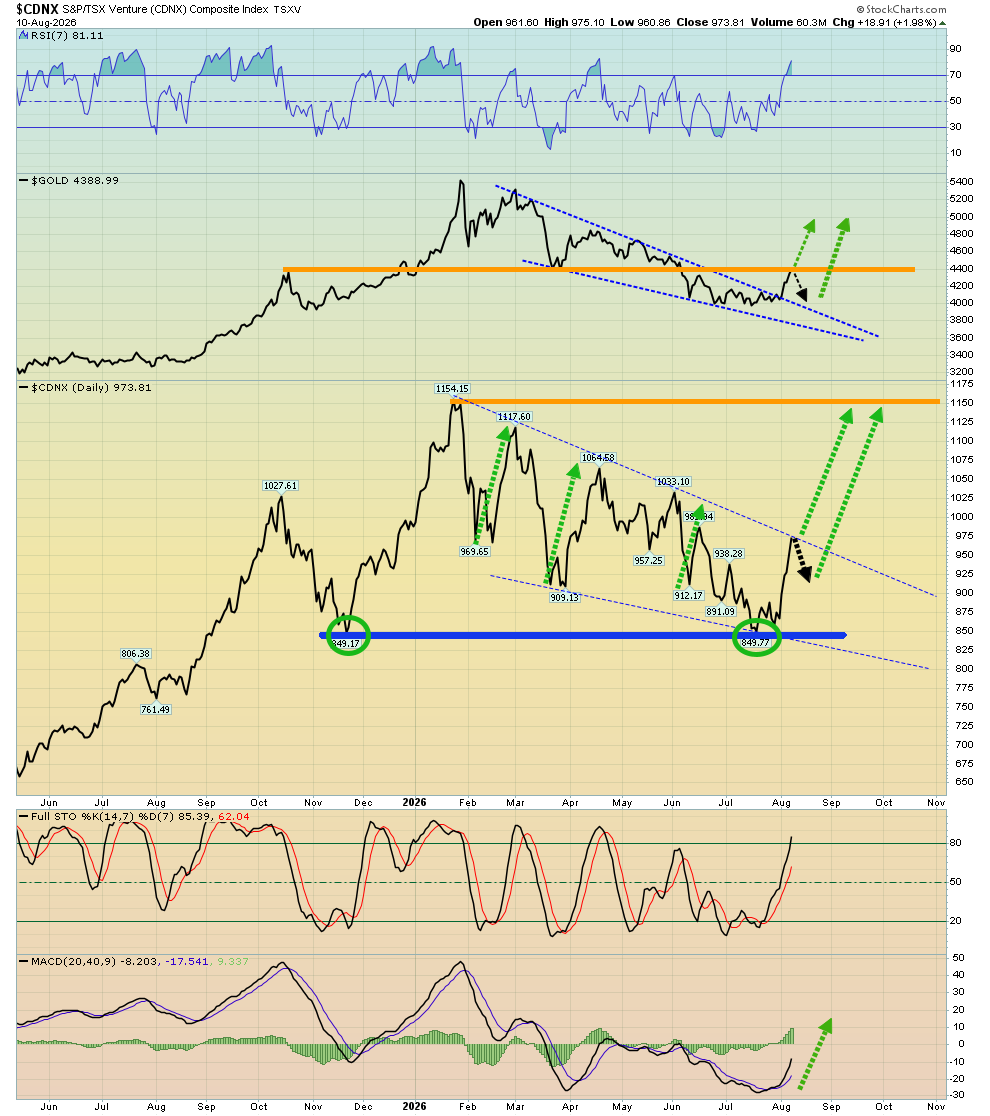
exciting CDNX line chart
A massive bull wedge is in play and MACD (20,40,10 series) suggests a breakout is imminent. Investors who acted in my previous buy zones (and the latest one at CDNX 850/gold $4000) are in great shape.
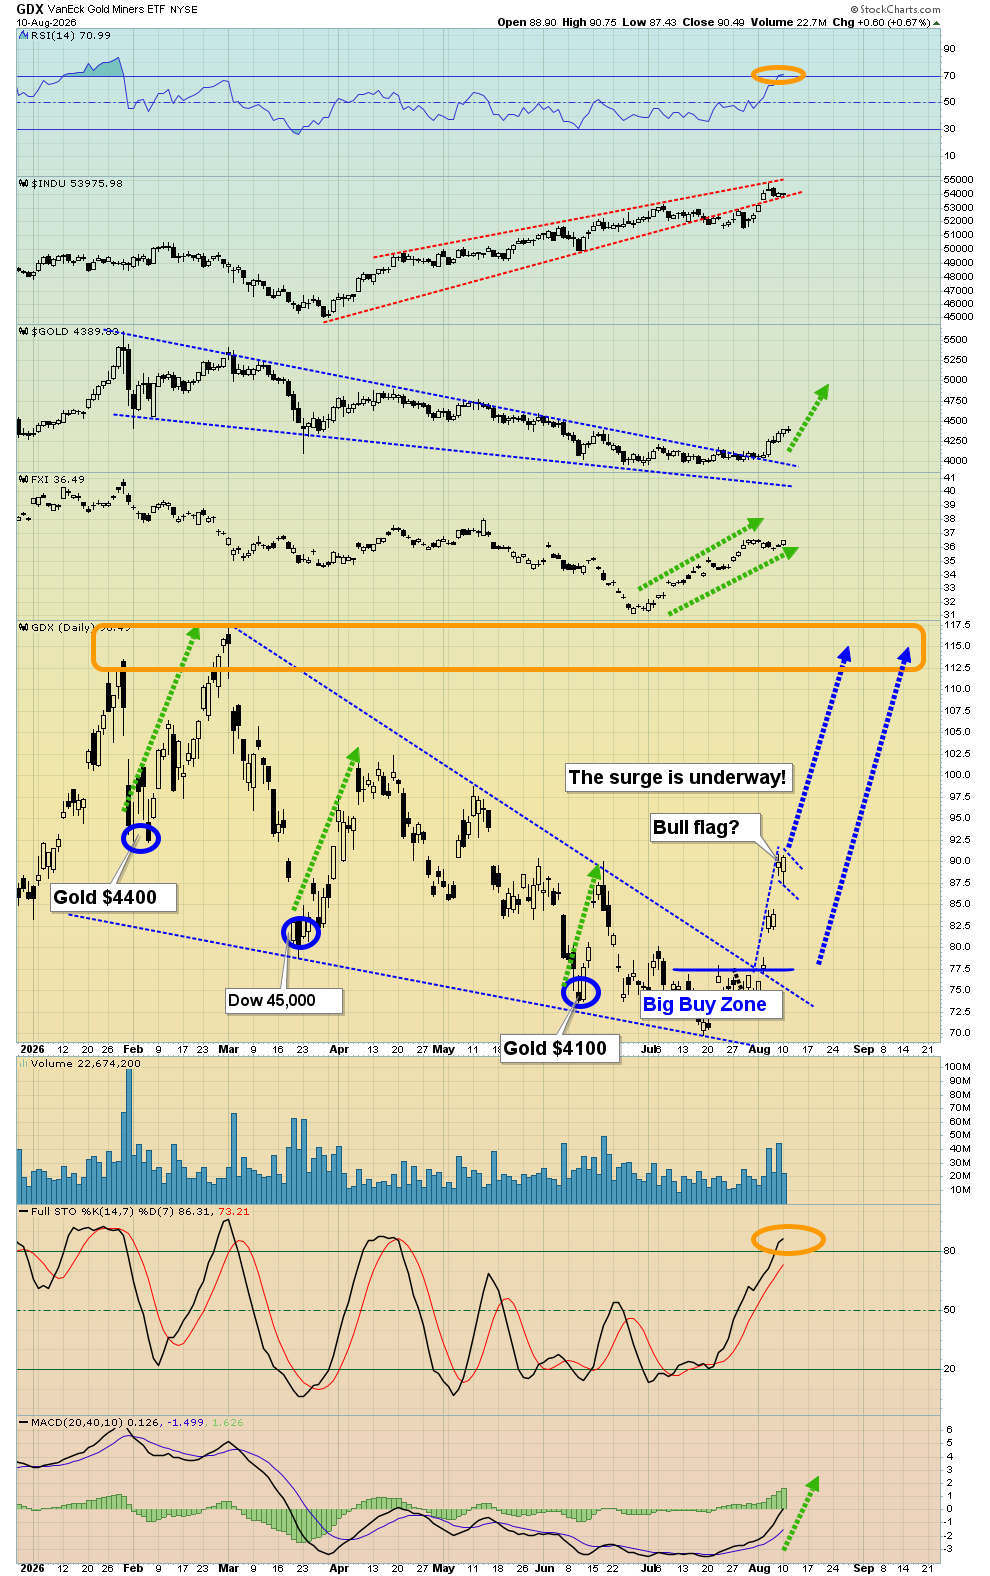
stunning GDX daily chart
This incredible ETF has surged about 28%... in just a few weeks!
Stochastics and RSI are now both overbought, so partial profits can be booked on buys done into the lows.
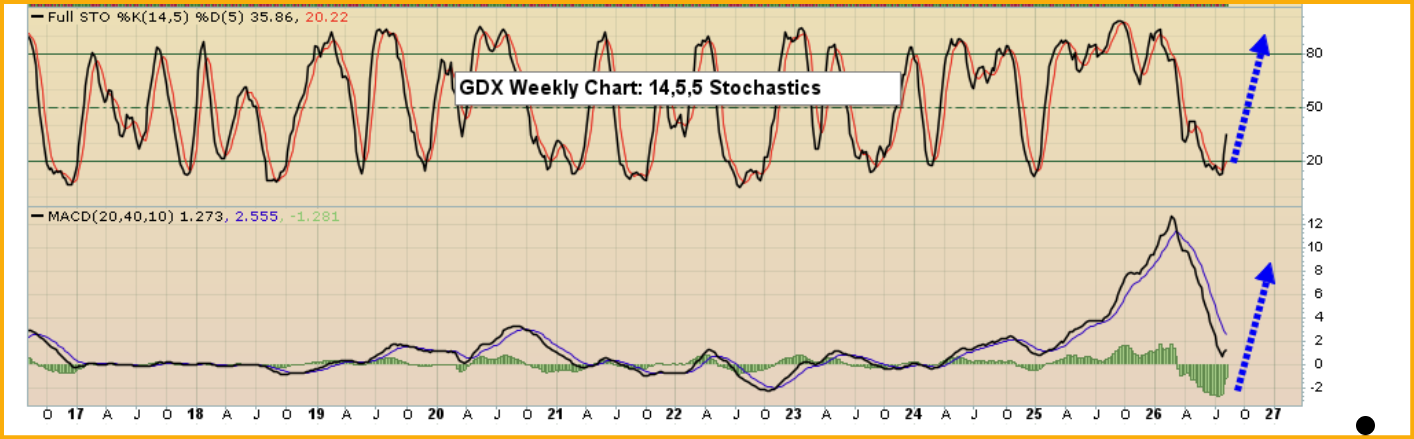
Basis the weekly chart, the senior miners have a lot of room to run. Stochastics is now out of the oversold zone and sporting a crossover buy signal and the MACD histograms are surging.
If inflation rises a bit after the release of the CPI and/or PPI reports, Western media will drag out their silly gold-rates narrative. Any dip in the metals market this week caused by their statements is likely to be very short-lived. Have a golden day!


Comments
Log in or sign up to join the conversation.