

Western media has created a powerful narrative that attempts to remove most of gold’s price drivers and replace them with a single, “Gold pays no interest” mantra.
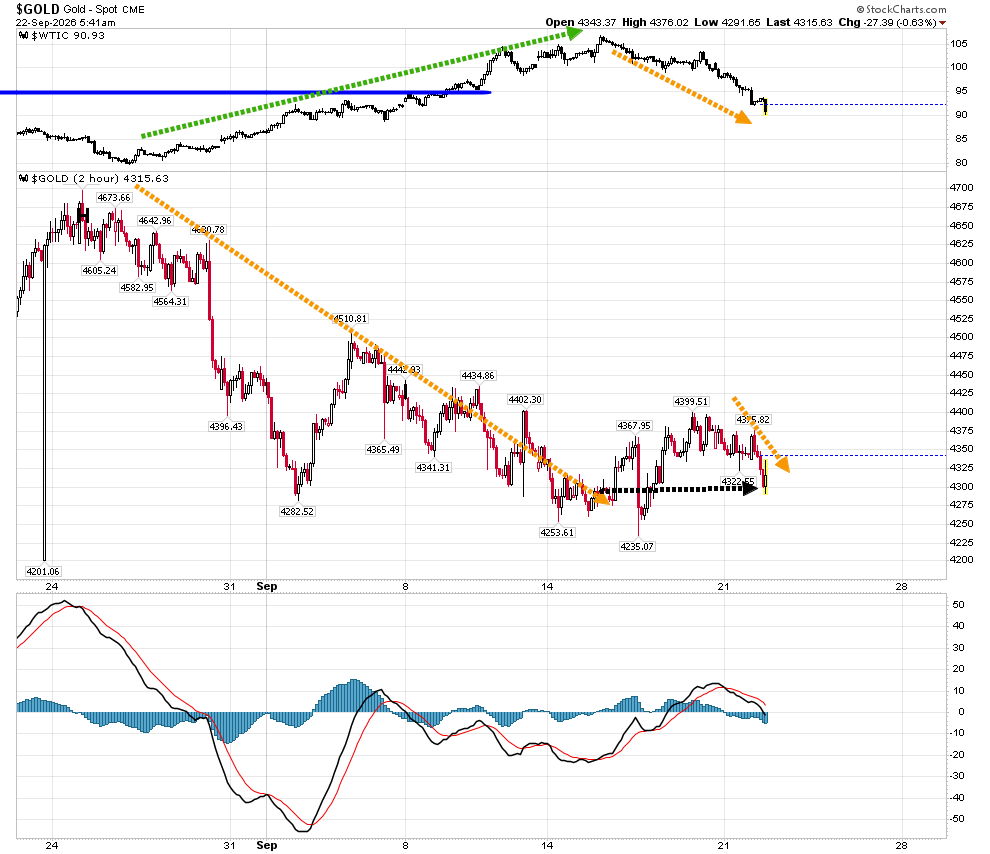
Gold fell while oil rose to $106, but it’s gone mostly sideways to down since oil has dropped back down to about $90.
That kind of price action can demoralize amateur investors and cause them to lose focus on the long-term buy zones for gold…
Even though nothing that governments and central banks say changes those key zones to buy.
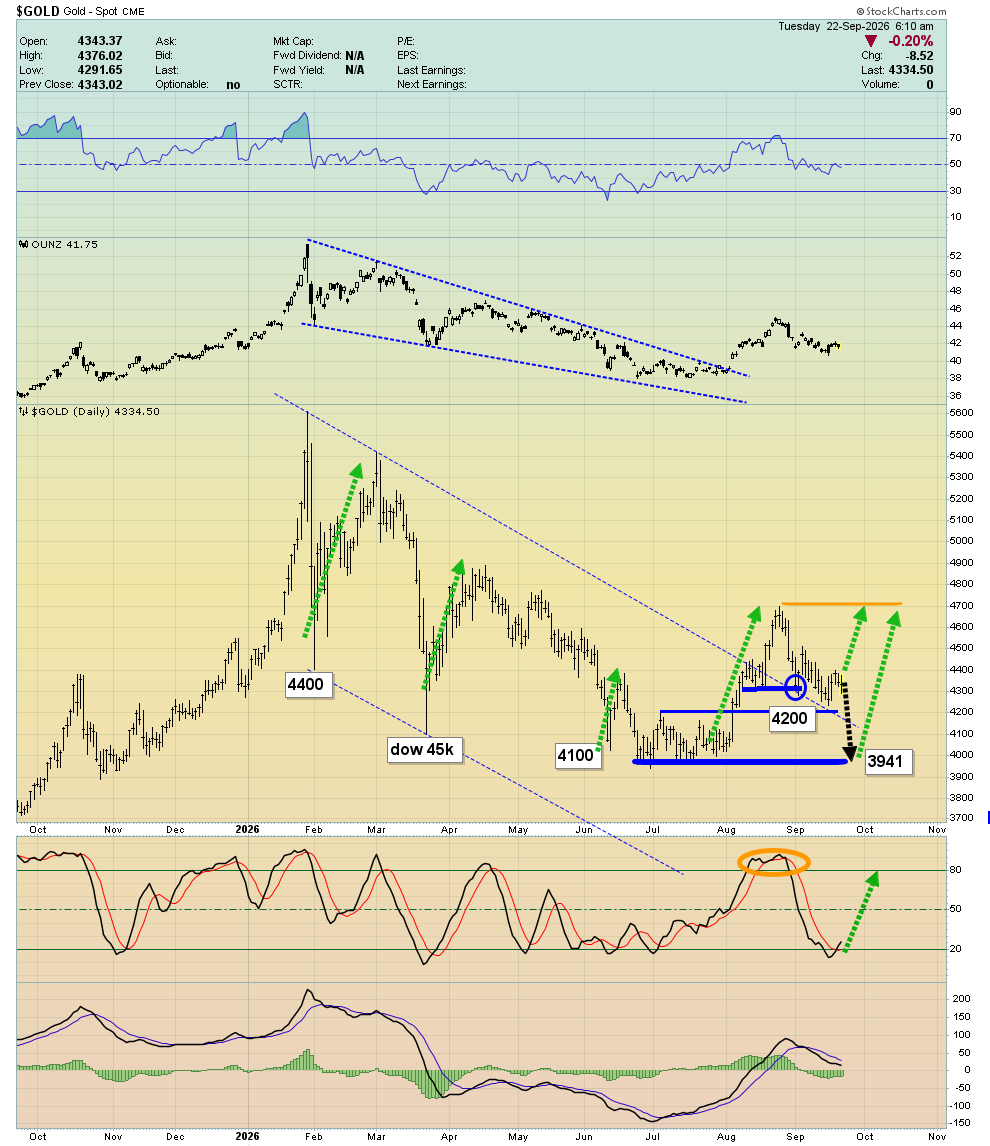
This daily chart presents a more stable picture of gold; Stochastics (14,7,7 series) is flashing a crossover buy signal as the price rises up from $4200 area support.
Profts can be booked at $4700, and more gold (plus silver and miners) should be bought at $3941.
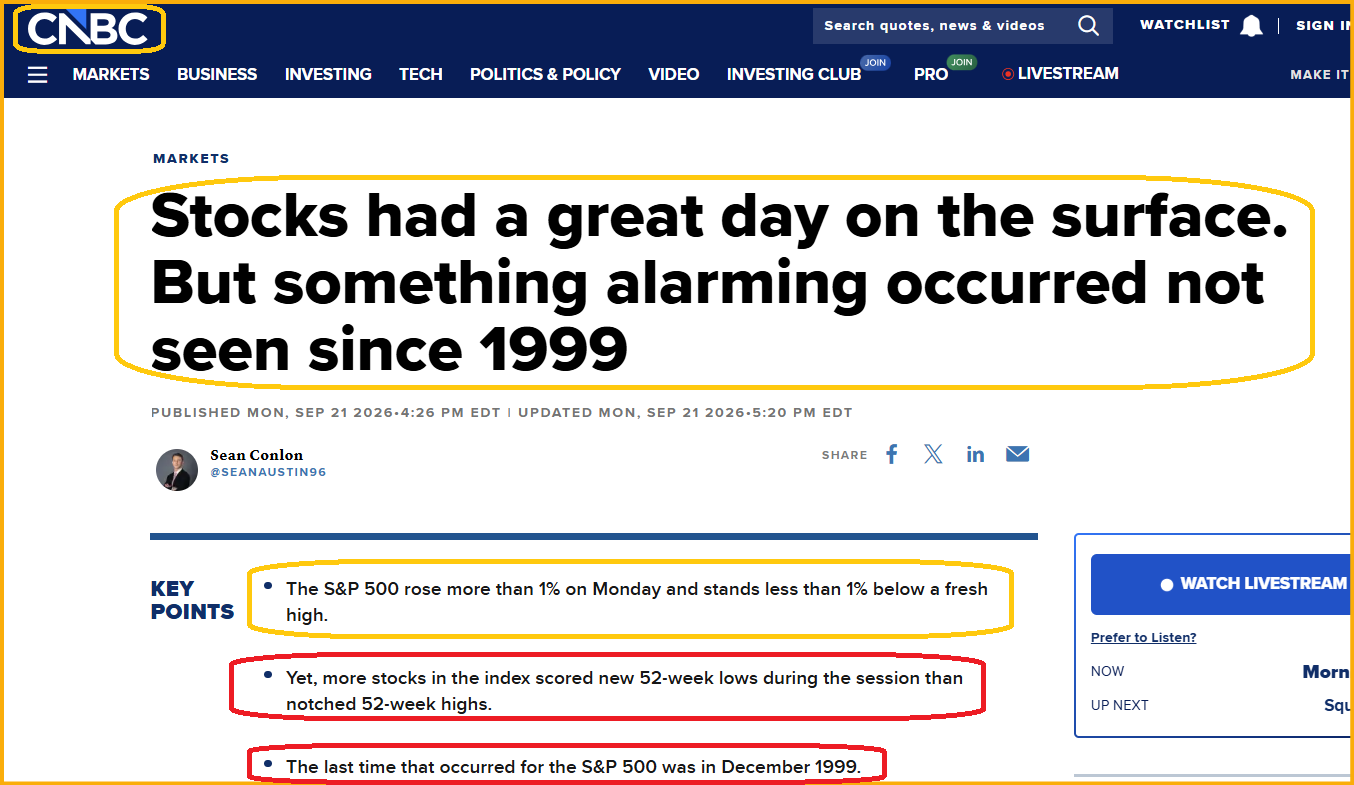
The outrageously overvalued US stock market hit another “milestone” yesterday.
For a closer look at it,
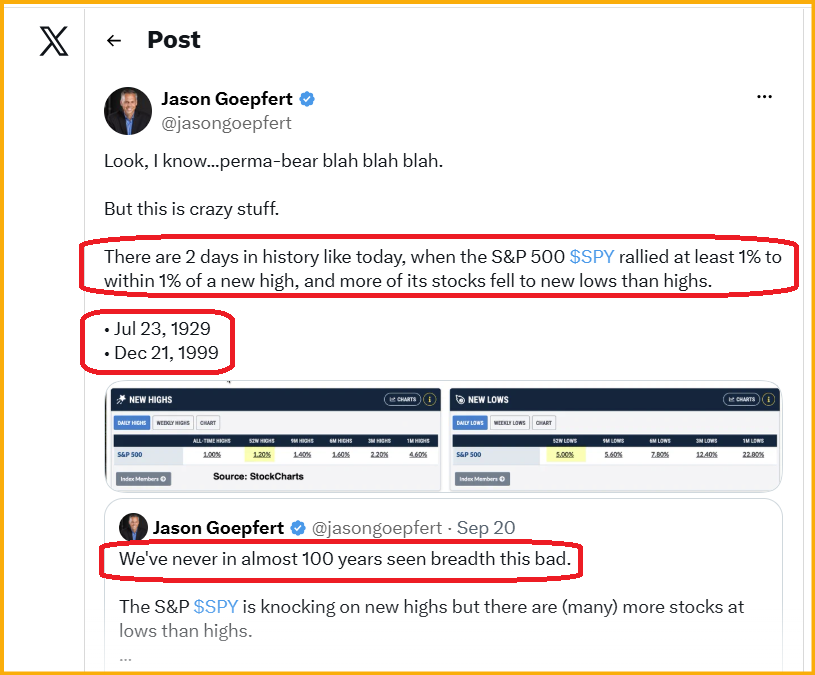
The market is soaring on one of the narrowest-breadth rallies in history.
At the same time, US consumer sentiment is near 50year lows. Citizens are being ravaged by “realflation” that is much higher than what is indicated by the government’s CPI, PPI, and PCE reports.
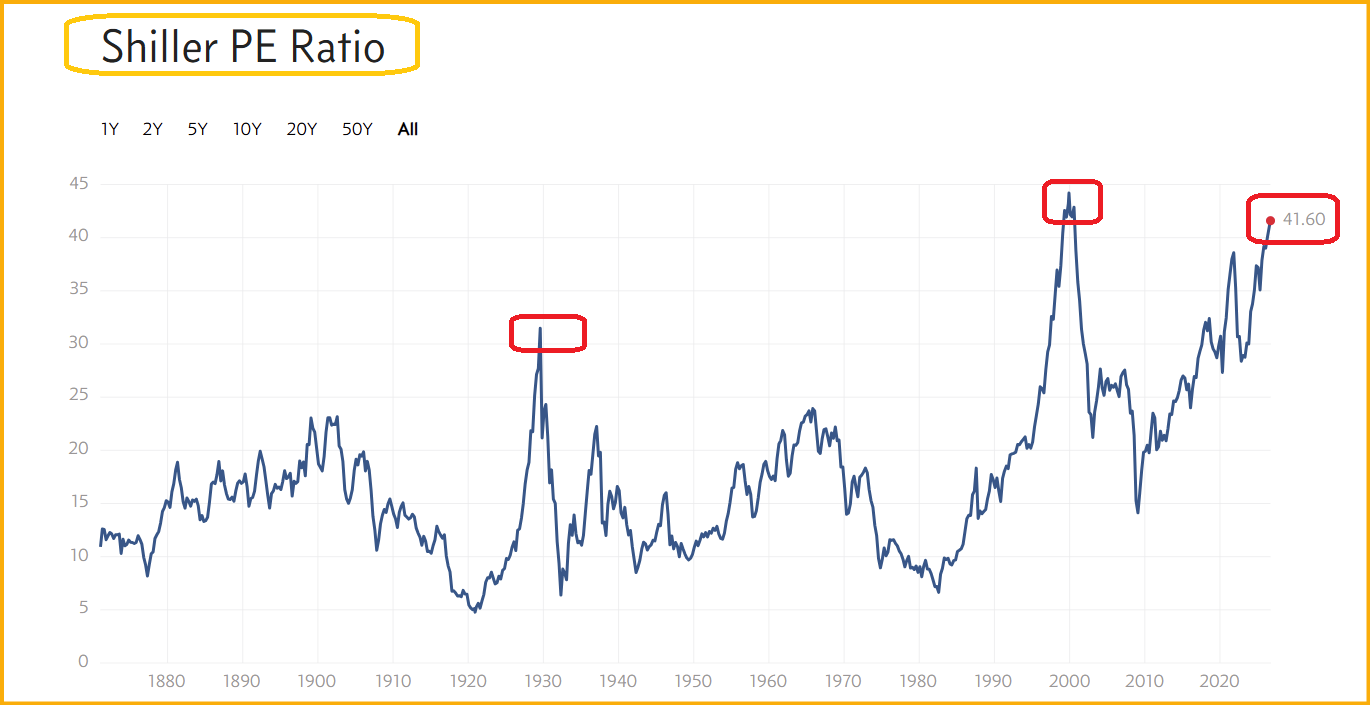
Basis the CAPE/Shiller ratio (inflation-adjusted PE), the SP500 (SPY) is at its second most overvalued point in history.
Rates?
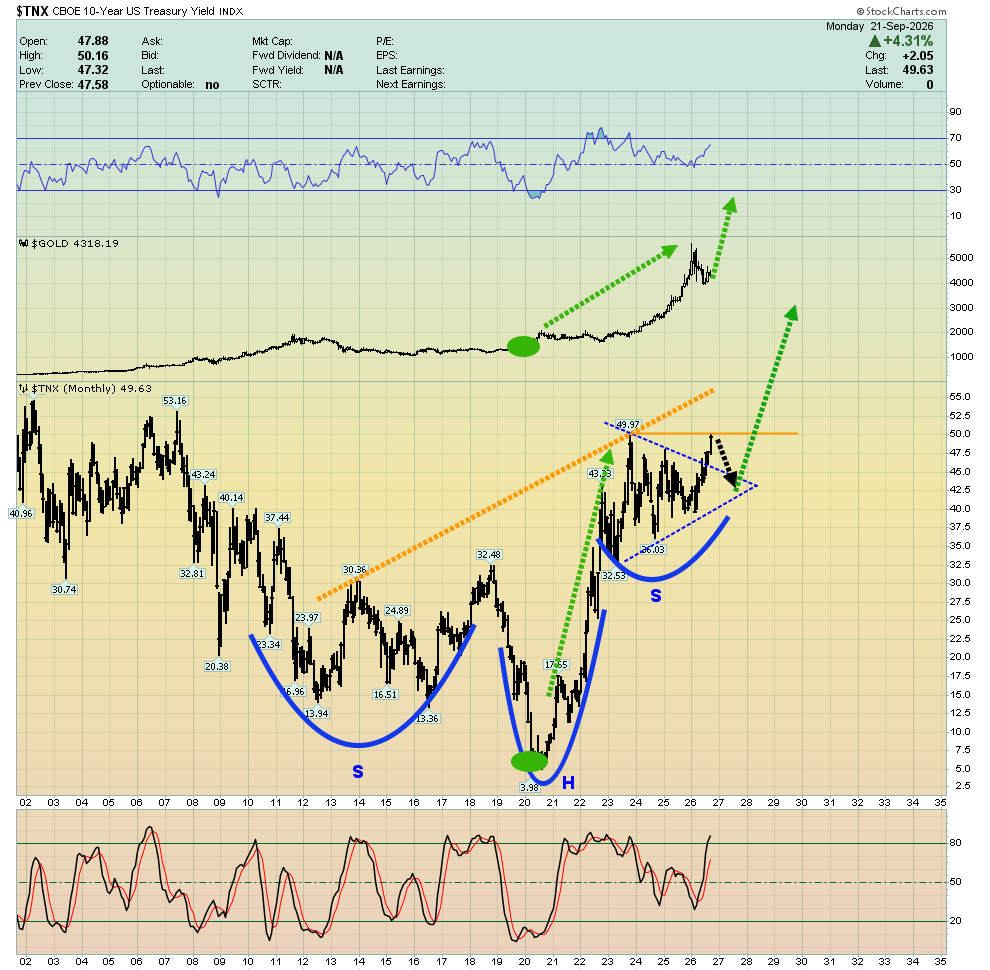
Gold could get some relief if this projected pullback in rates occurs.
It’s unknown if that pullback would add fuel to the stock market’s near-final surge… or if it would be related to a crash in the market.
Regardless, while AI “flyers” will continue to appear (and some will do well), it’s clear that it’s generally a time to lighten up on stock market holdings… and add to investments linked to gold.
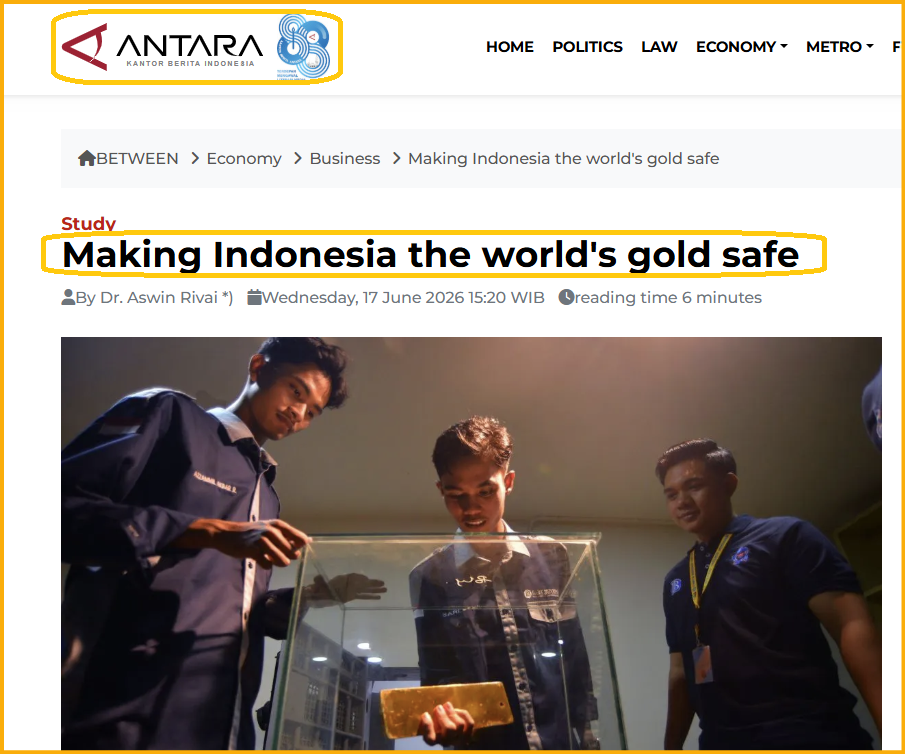
While Western media clings to its stone age “gold pays no interest” mantra, in the heavily populated East, the focus is on gold-themed infrastructure.
Indonesia is a G20 nation and could be ready to follow Singapore… and establish itself as a big gold storage and trading centre.
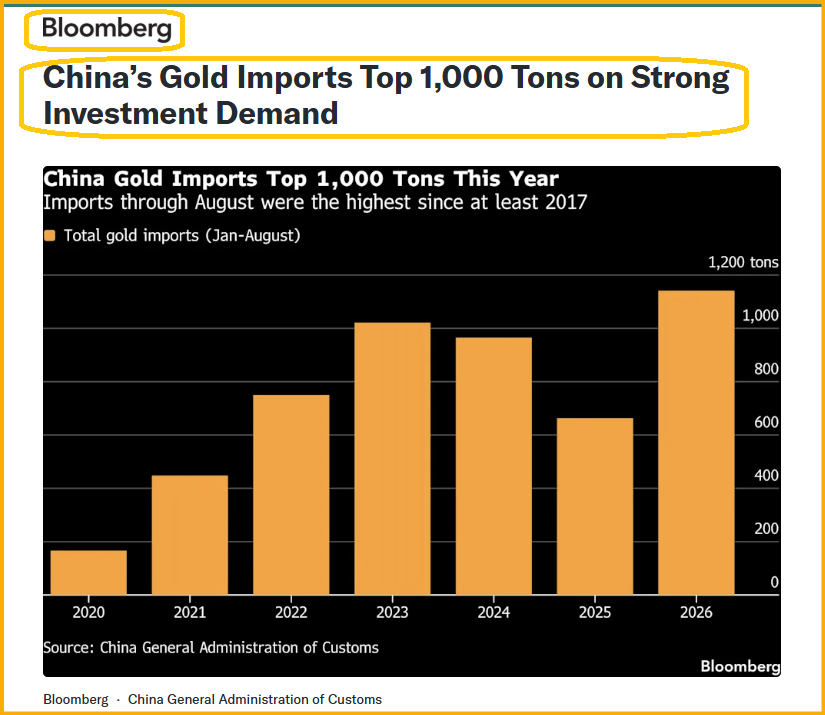
While childish COMEX gamblers sell gold in terror because rates might rise another quarter point, Chinese imports over the past 12 months are hitting ten-year highs!
Silver?
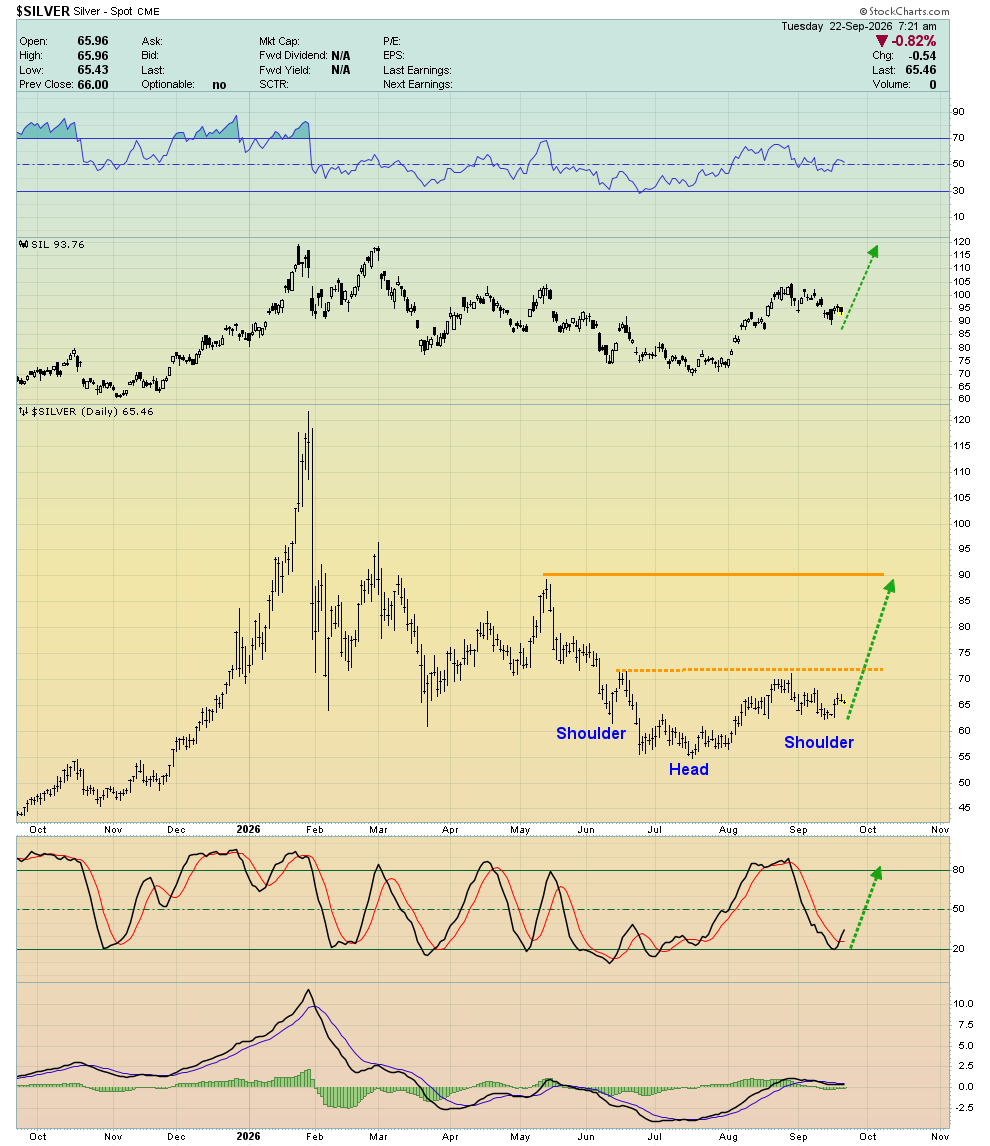
Here, silver looks enticing; Stochastics is on a buy signal near the oversold zone and there’s some decent inverse H&S action too.
The short-term target is about $70.
Also, note the price action of the SIL ETF at the top of the chart; it mimics silver’s zigs and zags… while offering more potential gain.
Next,
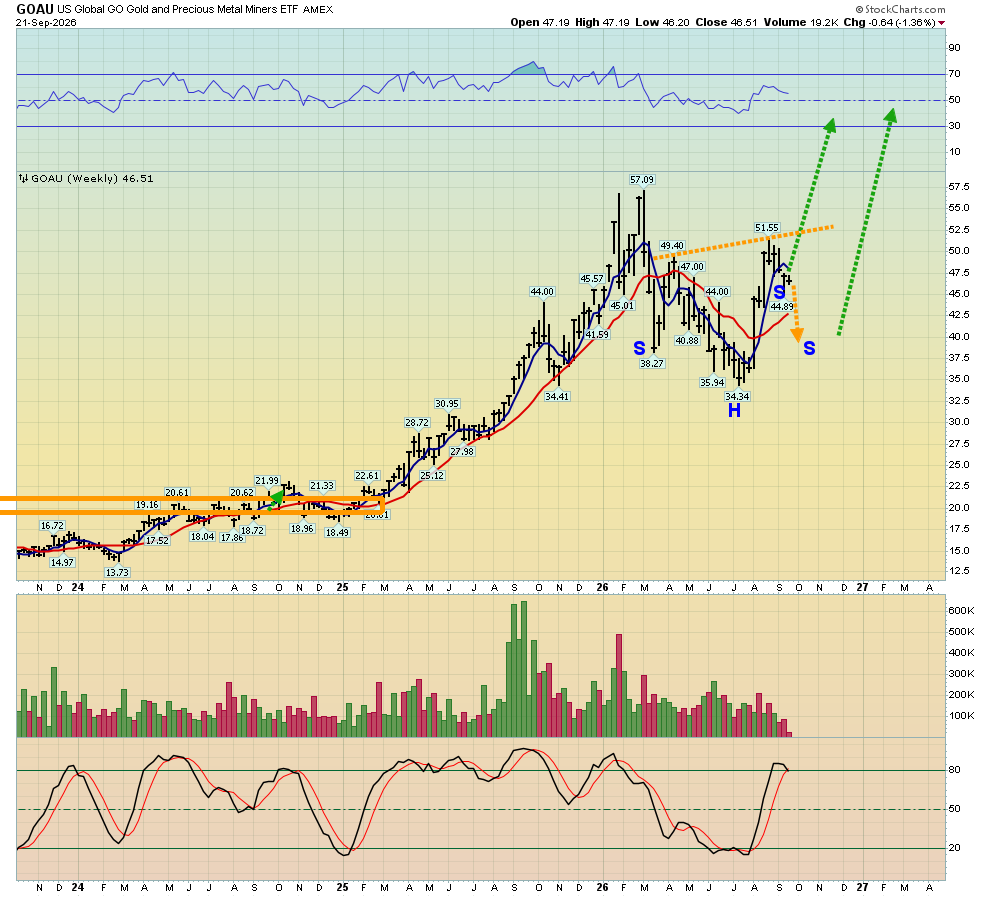
weekly GOEX ETF chart
A large inverse H&S bull continuation pattern is in play.
Short-term weakness would add more symmetry to the pattern. It appears that the bulls are beginning to take back control of the miners.
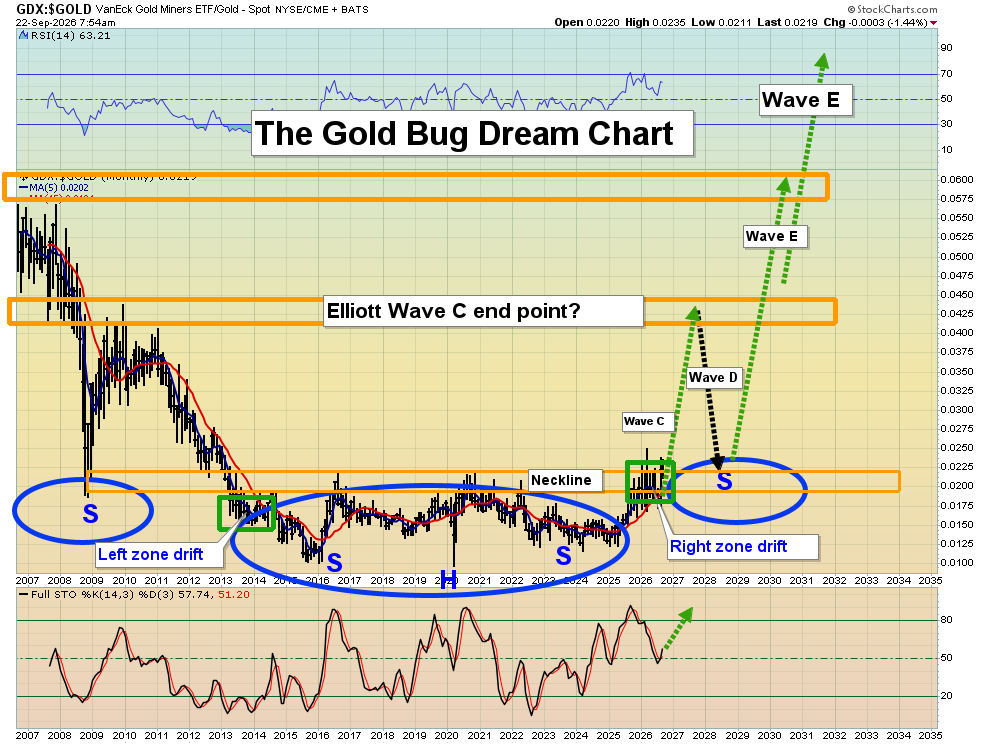
GDX versus gold chart
The massive base pattern is in sync with the rise of structural stagflation and a giant overvaluation top for the stock market.
Rather than guessing about the next $2/BBL move for oil, gold bugs should focus on key zones to buy more metals and miners… and stay up to date on bull era infrastructure developments in Asia. A positive outlook is a big part of long-term investor success!


Comments
Log in or sign up to join the conversation.