


Gold (XAU/USD) struggles to find acceptance above the $4,300 mark and retreats from its highest level since June 18, touched during the Asian session on Thursday amid the emergence of some US Dollar (USD) buying. A slew of prominent US Federal Reserve (Fed) officials recently warned that persistent inflation risks could necessitate further interest rate hikes, which revives the USD demand and caps the non-yielding bullion.
In fact, Fed Governor Lisa Cook stated that inflation remains too high and she is prepared to act by raising interest rates if disinflation stalls, warning that the central bank cannot afford to wait indefinitely if price pressures fail to ease. Meanwhile, San Francisco Fed President Mary Daly noted that officials need more data before the September meeting to see if inflation is temporary or lasting. Moreover, traders are still pricing in around an 80% chance that the US central bank will raise borrowing costs by the end of this year amid inflation risks stemming from supply disruptions through the Red Sea.
Iran-backed Houthis in Yemen said that they launched a missile attack on a Saudi oil tanker off the coast of the port city of Yanbu and another in the Gulf of Aden. Investors, however, remain hopeful about a US-Iran peace deal and the reopening of the Strait of Hormuz, which keeps oil prices depressed near a multi-week low. Iran said on Wednesday that it is in the final stage of drafting an agreement with Oman over the strategic waterway. This fuels optimism about a diplomatic resolution to end a five-month-old war, which, in turn, should cap any meaningful USD appreciation and support Gold.
Adding to this, Automatic Data Processing (ADP) reported on Wednesday that private-sector employment in the US grew by 40K in July, marking a notable slowdown from the 95K in the prior month and missing consensus estimates. Separately, data from the Institute for Supply Management (ISM) showed the Services PMI improved a tad to 54.1 in July from 54.0 in the previous month, coming in below expectations for a reading of 54.5. Following the softer data, the probability for a September Fed rate hike eased to roughly 55% from 67%, further warranting some caution for USD bulls.
Moreover, traders might opt to wait for the release of the closely-watched US monthly employment details – popularly known as the Nonfarm Payrolls (NFP) report on Friday – for more cues about the Fed's future policy path. In the meantime, Thursday's US economic docket features the usual Weekly Initial Jobless Claims, which, along with comments from influential FOMC members, will drive the USD demand. Apart from this, further developments surrounding the Middle East crisis could infuse volatility in the global financial markets, which could further provide some impetus to the buck and produce short-term trading opportunities around Gold.
XAU/USD daily chart
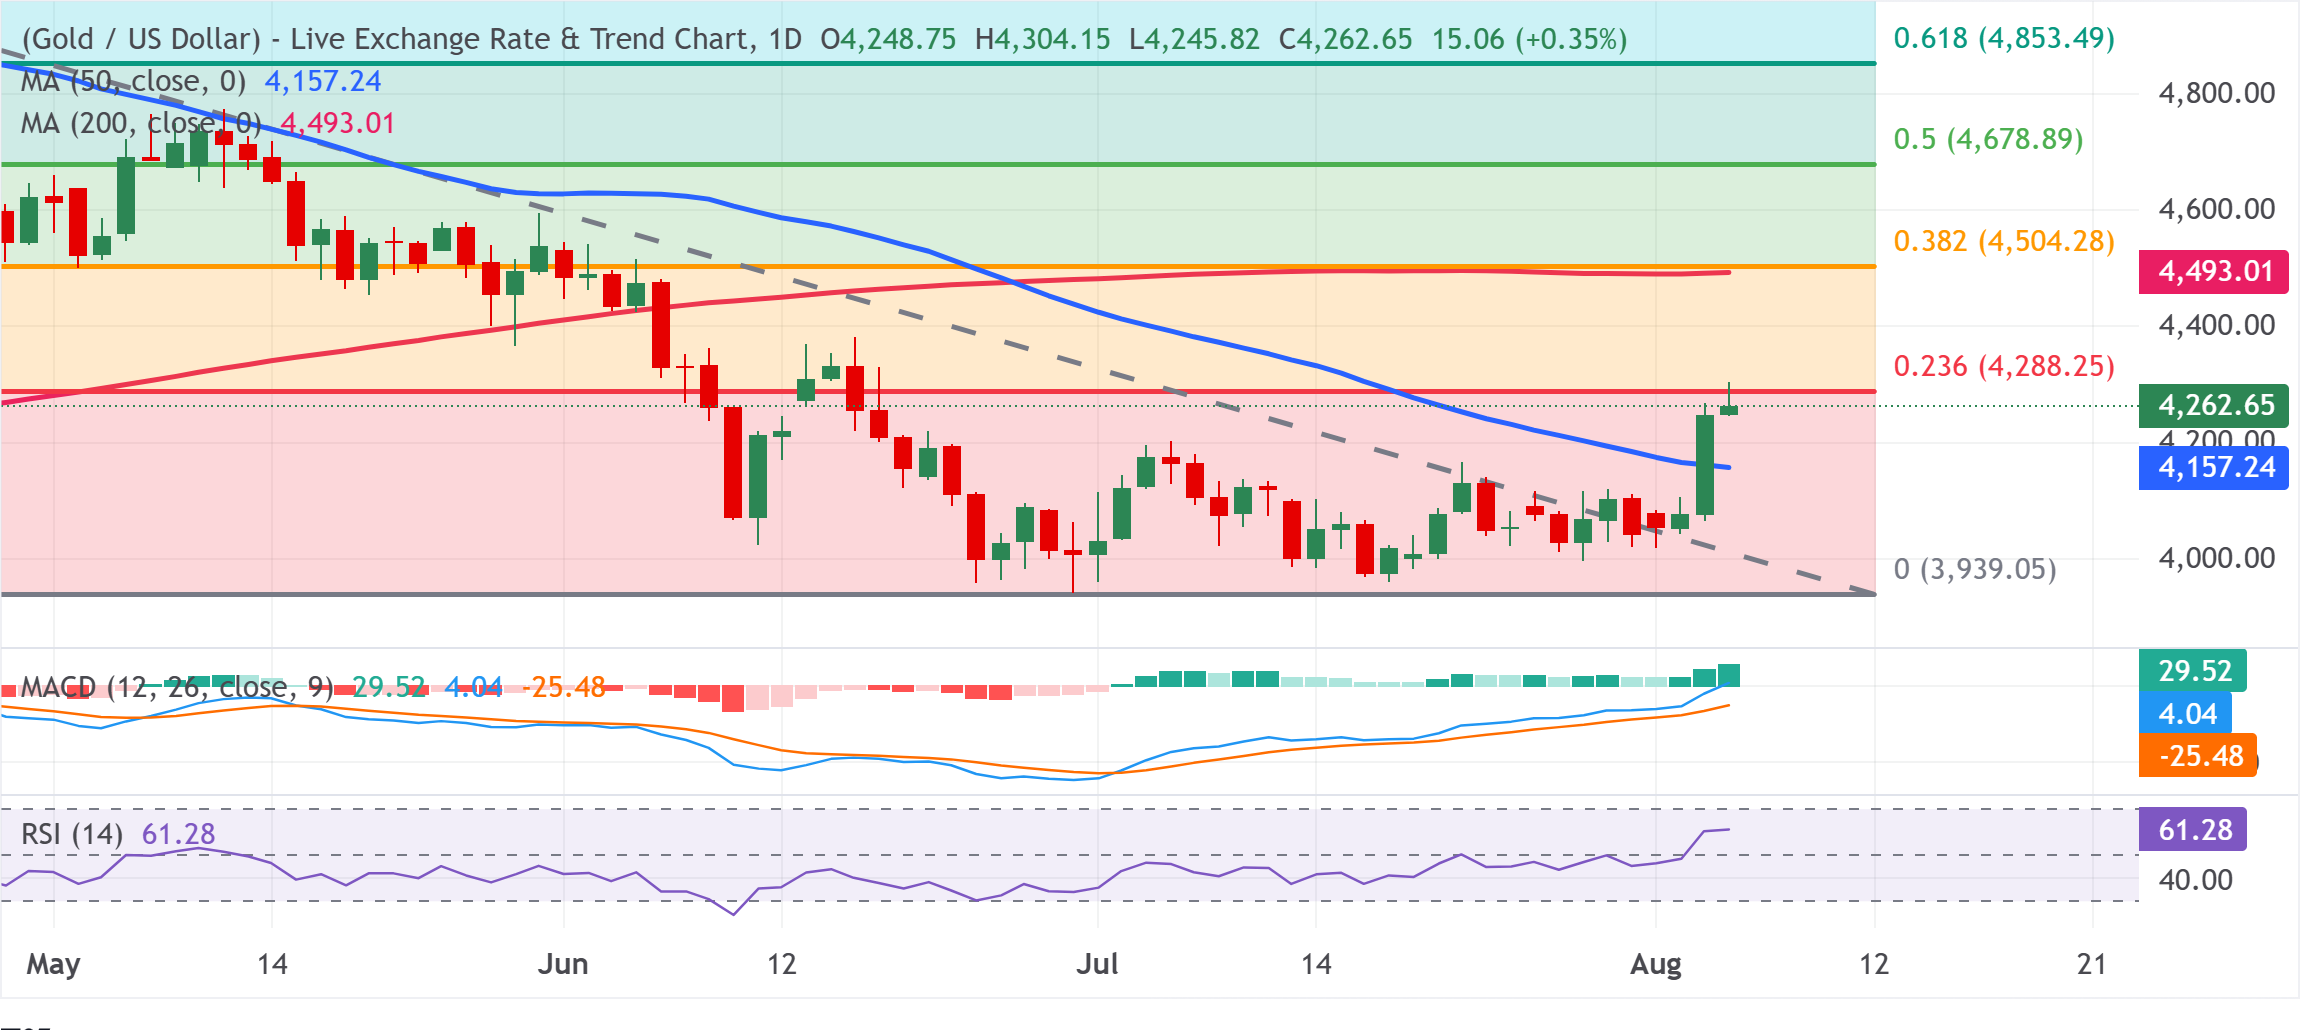
Technical Analysis: Gold struggles to find acceptance above $4,300; bullish bias remains
The overnight strong move up beyond the 50-day Simple Moving Average (SMA) for the first time since March 17 was seen as a fresh trigger for XAU/USD bulls. Moreover, a firming Moving Average Convergence Divergence (MACD) at 29.52 and a Relative Strength Index (RSI) at 61.28 hint at improving bullish momentum. However, it will still be prudent to wait for some follow-through buying beyond the 23.6% Fibonacci retracement level of the March-June downfall before positioning for any further gains.
The precious metal might then aim to challenge the $4,500 psychological mark – representing the 200-day SMA and the 38.2% Fibo. level confluence. Higher up, the 50.0%, 61.8% and 78.6% retracements at $4,678.89, $4,853.49 and $5,102.07 respectively outline subsequent bullish objectives if the current band is cleared. On the downside, immediate support is provided by the 50-day SMA at $4,157.24, while a deeper setback would likely look toward the Fibonacci cycle low area near $3,939.05 as a more substantial structural floor.
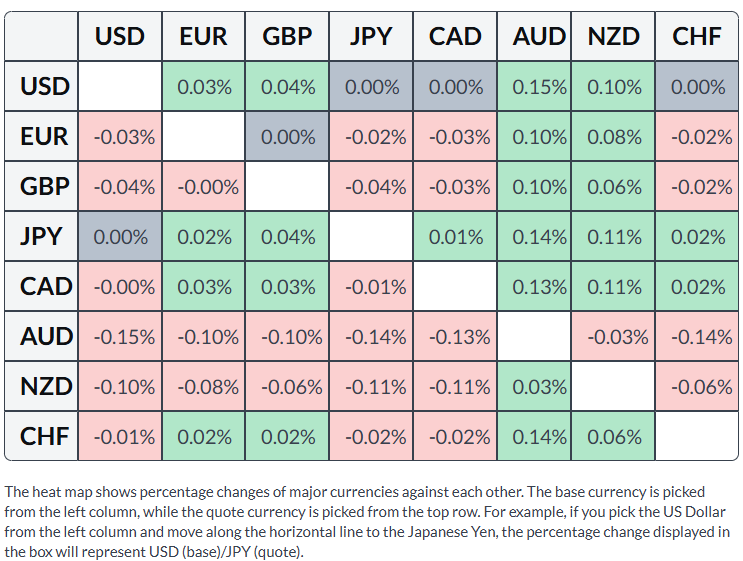
US Dollar Price Today
The table below shows the percentage change of the US Dollar (USD) against listed major currencies today. US Dollar was the strongest against the Australian Dollar.



Comments
Log in or sign up to join the conversation.