
Latest Price – $1340.20.
Daily Chart
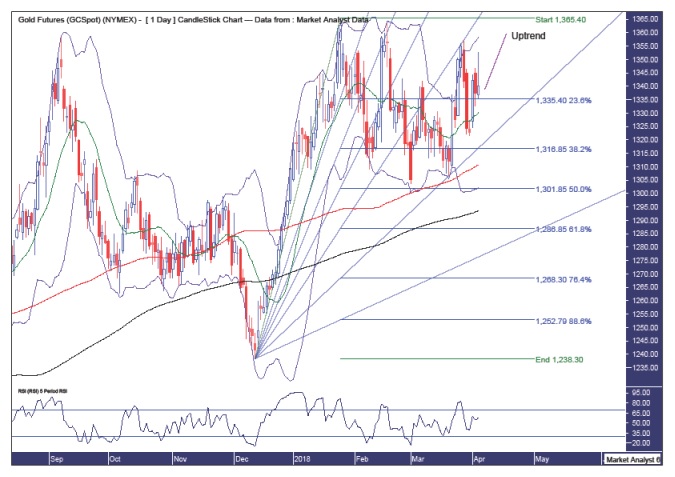
Pattern – price looks to have been consolidating these past few months and as the price rose into this consolidation pattern it should leave the same way – up. Breaking below the low of this consolidation phase at $1303 could be one area to place stops.
Bollinger Bands – price found support three separate times at the lower band. I doubt there will be a fourth time and price looks to have recently found support at the middle band.
Fibonacci – price retraced to just above the 50% level leaving the uptrend in a solid position. The 61.8% angle has been providing resistance while the 76.4% angle has provided support and I would not like to see a solid move below this 76.4% angle. I doubt that and instead believe price can trade up along the 61.8% angle to new rally highs. Let’s see.
Moving averages – in a bullish position with the 100-day moving average (red) above the 200-day moving average (black).
RSI – in strong territory and generally trending up – a good sign.
Monthly Chart
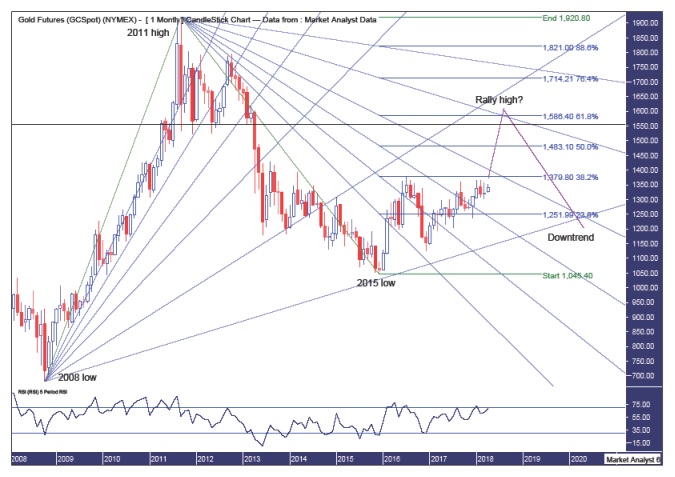
Pattern – price is knocking on the door of overhead resistance set in July 2016 at $1377 and I believe a break above that level is imminent. I also believe this is a bear rally only and a sharp rally from here will get punters thinking the bull market is back on. I believe that would be a wrong assumption.
Fibonacci – resistance has been the 38.2% retracement level while I am looking for the bear rally to ultimately terminate around the 61.8% level at $1586. The bullish fan shows the 88.6% angle providing support for 2015 low and the 76.4% angle is now resistance although I doubt price can reach it. It may go close though. I am looking for price to rally up to the 76.4% angle on the bearish fan before the overall downtrend resumes.
Horizontal line – denotes the February 2013 low of $1554 and that is where the gold crash of 2013 picked up steam after breaking below that level. Price often returns to where a crash started and that is where I believe the price is headed and perhaps nudging a touch above.
RSI – in a very strong position and a cracking move higher now would not surprise at all.
Summing up – bullish over coming months, expecting a solid move higher to complete the bear rally that has been in force since the 2015 low.


Comments
Log in or sign up to join the conversation.