
Gold is currently trading near a critical level, from where a massive move up or down is imminent. One of the measures that illustrate we are a close to a big move, is the following resistance line on the gold chart that I have previously highlighted. Below, is a gold chart (from tradingview.net) with the resistance line indicated:
(Click on image to enlarge)

The red line is the critical obstacle that the gold price has to overcome, for the continuation of the gold bull market. Furthermore, since the price has now failed more than four times at the line, there is a great chance that we could see a big drop.
However, if the price is to turn around and break through the resistance line, then a great amount of energy is required to fuel such a move. This kind of energy can only come from a collapse of a big market like the general stock market, or the bond market.
In my view, it is clear that the next major gold and silver rally will be driven by a stock market collapse.
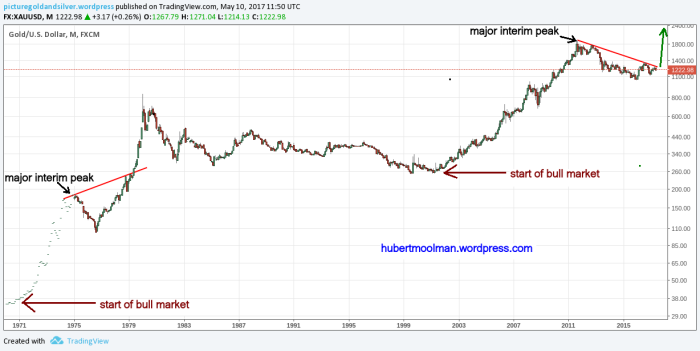
When gold breaks through the resistance line, we will see a gold rally like that of 1979/1980. In fact, there is a peculiar fractal that suggests the current situation for gold is very similar to that of May 1979, just before the massive rise in gold – see the following long-term gold chart (which is self-explanatory):
(Click on image to enlarge)


Comments
Log in or sign up to join the conversation.