


Gold (XAU/USD) remains on the back foot heading into the European session on Friday, though it lacks follow-through selling and holds above the $4,500 psychological mark. The US Dollar (USD) holds steady near a six-week high, touched on Wednesday, amid hawkish Federal Reserve (Fed) expectations. Apart from this, mixed signals over a potential US-Iran peace deal benefit the Greenback's reserve currency status and turn out to be a key factor that undermines demand for the commodity.
Market participants have completely priced out any possibility of a rate cut by the Fed for the remainder of 2026; instead, they are now betting on at least one rate hike before year-end amid rising energy prices and consumer inflation fears. Moreover, Minutes from the April 28–29 FOMC meeting released on Wednesday revealed officials leaning toward keeping rates elevated, or even raising them, if inflation continues to run persistently above the 2% target. The CME Group's FedWatch Tool indicates over a 60% chance that the US central bank will raise borrowing costs by 25 basis points (bps) at the December meeting. The outlook had been a key factor behind the recent surge in US Treasury bond yields, supporting the USD and weighing on the non-yielding Gold.
Meanwhile, a senior Iranian source said that no deal has been reached with the US, but the gaps in positions between the two sides have narrowed. However, Iran's uranium enrichment and Tehran's control over the critical Strait of Hormuz remain among the sticking points. US Secretary of State Marco Rubio warned that Iran’s desire to impose a toll on ships passing through the Strait was acting as a blockade to a potential peace agreement. US President Donald Trump also said that the US does not want tolls on the Strait of Hormuz and added that the US military will retrieve Iran's stockpile of highly enriched uranium. This keeps geopolitical risk premium in play and favors the USD bulls, suggesting that the path of least resistance for Gold is to the downside.
XAU/USD 4-hour chart
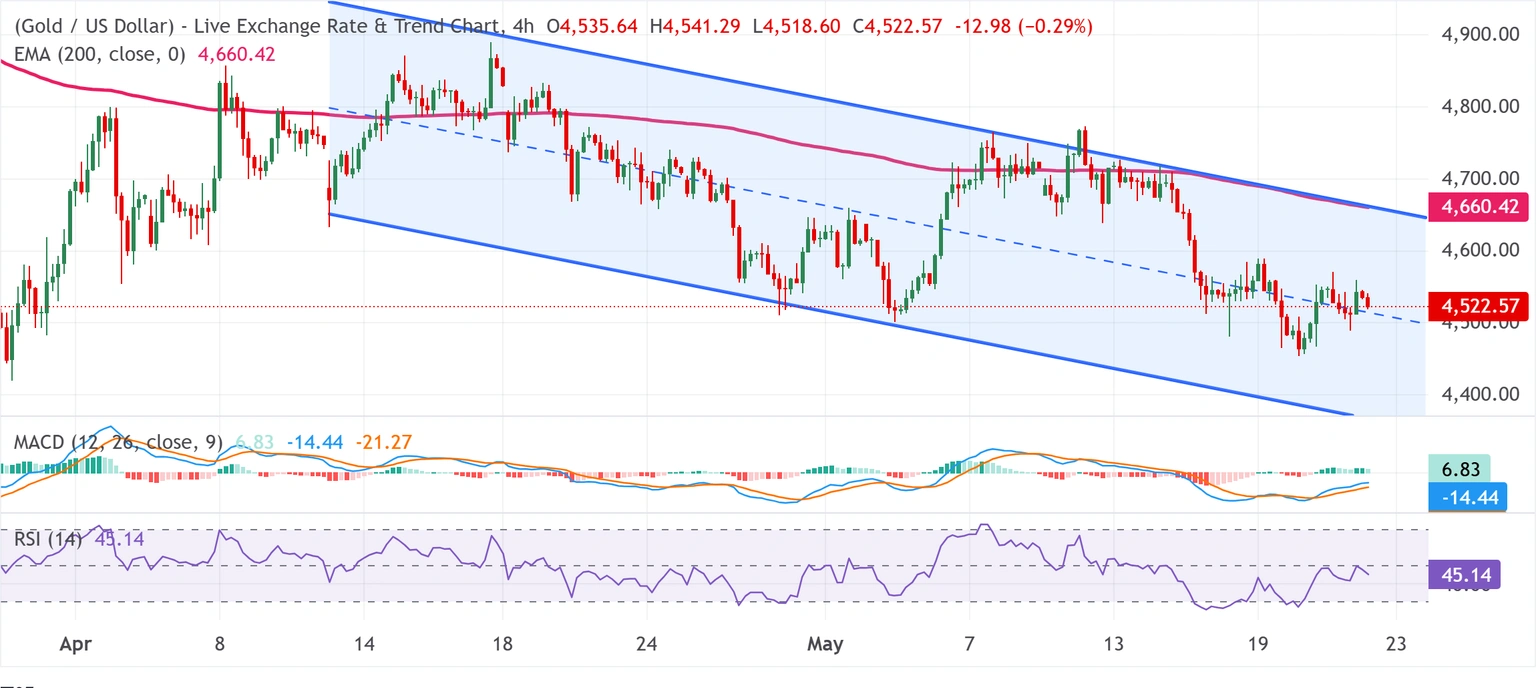
Gold technical setup backs the case for further weakness in the near-term
From a technical perspective, the XAU/USD pair is holding within a broader descending channel and below the 200-period Exponential Moving Average (EMA) on the 4-hour chart, keeping the near-term bias capped despite some stabilization. The top of the downward-sloping channel near $4,657.44 converges with the 200-period EMA to form a dense overhead supply area. This, in turn, suggests that recovery attempts are likely to struggle while the Gold price remains under this band.
Meanwhile, the Moving Average Convergence Divergence (MACD) indicator has turned positive, while the Relative Strength Index (RSI) hovers around 45. Mixed momentum indicators hint at easing downside momentum, though they are not yet signaling a decisive bullish shift against the dominant structural downtrend. Hence, a clear break above the aforementioned clustered resistance zone would be needed to relieve the current bearish pressure.
On the downside, the lower boundary of the parallel channel near $4,362.54 acts as the next meaningful support. A sustained break beneath this floor would reinforce the broader bearish structure and open the way for deeper losses in the coming sessions.
(The technical analysis of this story was written with the help of an AI tool.)
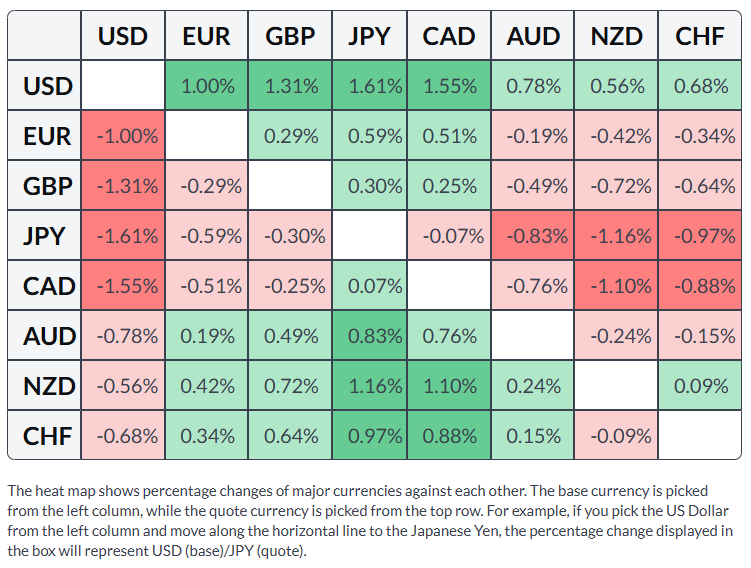
US Dollar Price This Month
The table below shows the percentage change of US Dollar (USD) against listed major currencies this month. US Dollar was the strongest against the Japanese Yen.



Comments
Log in or sign up to join the conversation.