


Gold faces renewed pressure after the rebound on Monday towards $3,970. The correction in oil prices eased fears of inflation and supported a recovery in gold. But fresh Middle East tensions could lift energy prices again. The expectations of a rate hike and investor selling also threaten the rebound. The weekly break below $3,900 increases the risk of a deeper correction towards $3,500-$3,600. This support area may attract buyers within the broader bullish structure.
Rate Hike Bets and Investor Selling Weigh on Gold
Gold rebounded to around $3,970 an ounce on Monday as oil prices dropped more than 4%. The talks between Iranian and Qatari officials raised hopes that Middle East supply disruptions could ease. The correction in oil prices reduced inflation pressure and weakened the case for further hikes in interest rates. This supported the recovery in gold market on Monday.
However, the latest attacks on Iran by the US have increased fears of inflation and created a rebound in oil prices on Tuesday. Gold prices dropped again on Thursday and remained under pressure ahead of the US midterm election.
The expectations for higher US interest rates remain a major risk. Dallas Fed President Lorie Logan called for at least two more quarter-point rate increases on Friday. The market priced in about 73% chance of a December hike this week. The high rates make cash and bonds more attractive because they pay interest. This could limit the recovery in gold even if oil prices continue to fall.
The selling by investors adds another source of pressure. The gold-backed ETFs lost six tonnes of holdings last week. The continued losses in technology stocks also force investors to sell gold to cover losses elsewhere. This means gold can face selling pressure even when markets turn cautious. In my view, gold needs calmer equity markets and weaker expectations for rate hikes before it can build a lasting recovery.
Gold Price Forecast: Key Support and Recovery Levels
Long-Term Chart: Gold Could Find Support at $3,500–$3,600
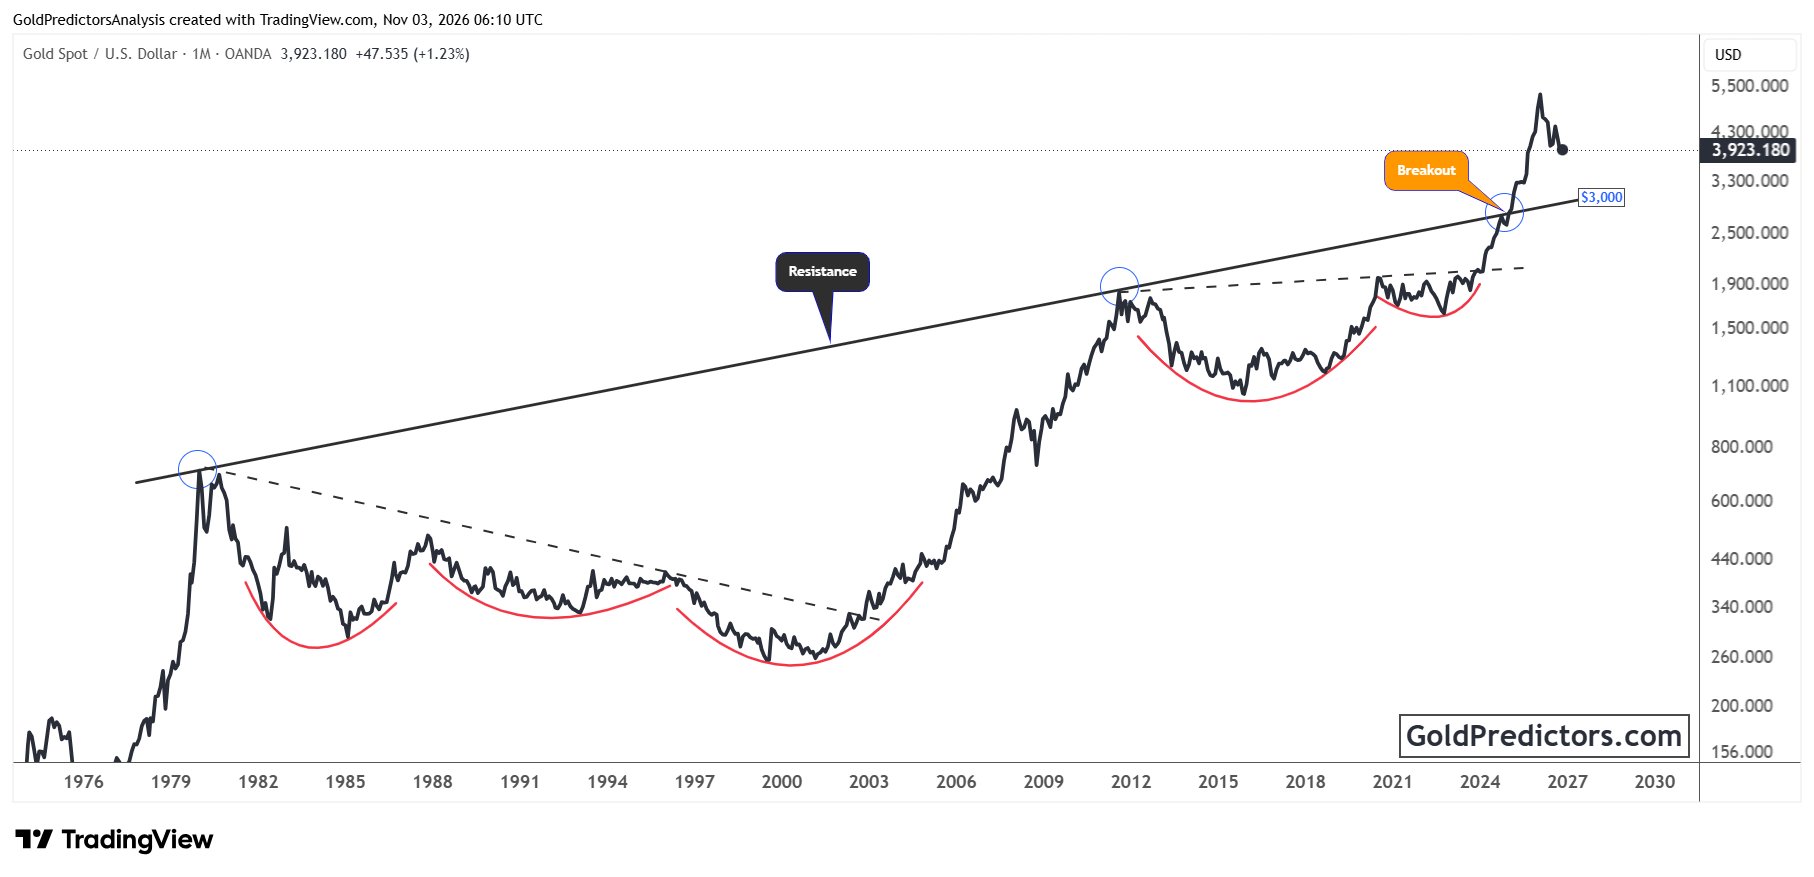
From a technical perspective, the gold price produced a record high of $5,600 in January 2026 and triggered a strong correction. This record high was triggered when the gold price broke above the ascending trend line at the $2,800 level in January 2025. This trend line stretches from the 1980s highs.
This breakout pushed gold prices towards record highs, and now prices are correcting lower to find support. The long-term support at the ascending trend line lies near the $3,000 level. If the gold price corrects to the $3,000 level, it will likely provide a long-term opportunity for investors to accumulate positions. Moreover, the cup and handle formation from the 2011 highs to the 2023 breakout suggests that the overall price structure remains strongly bullish.
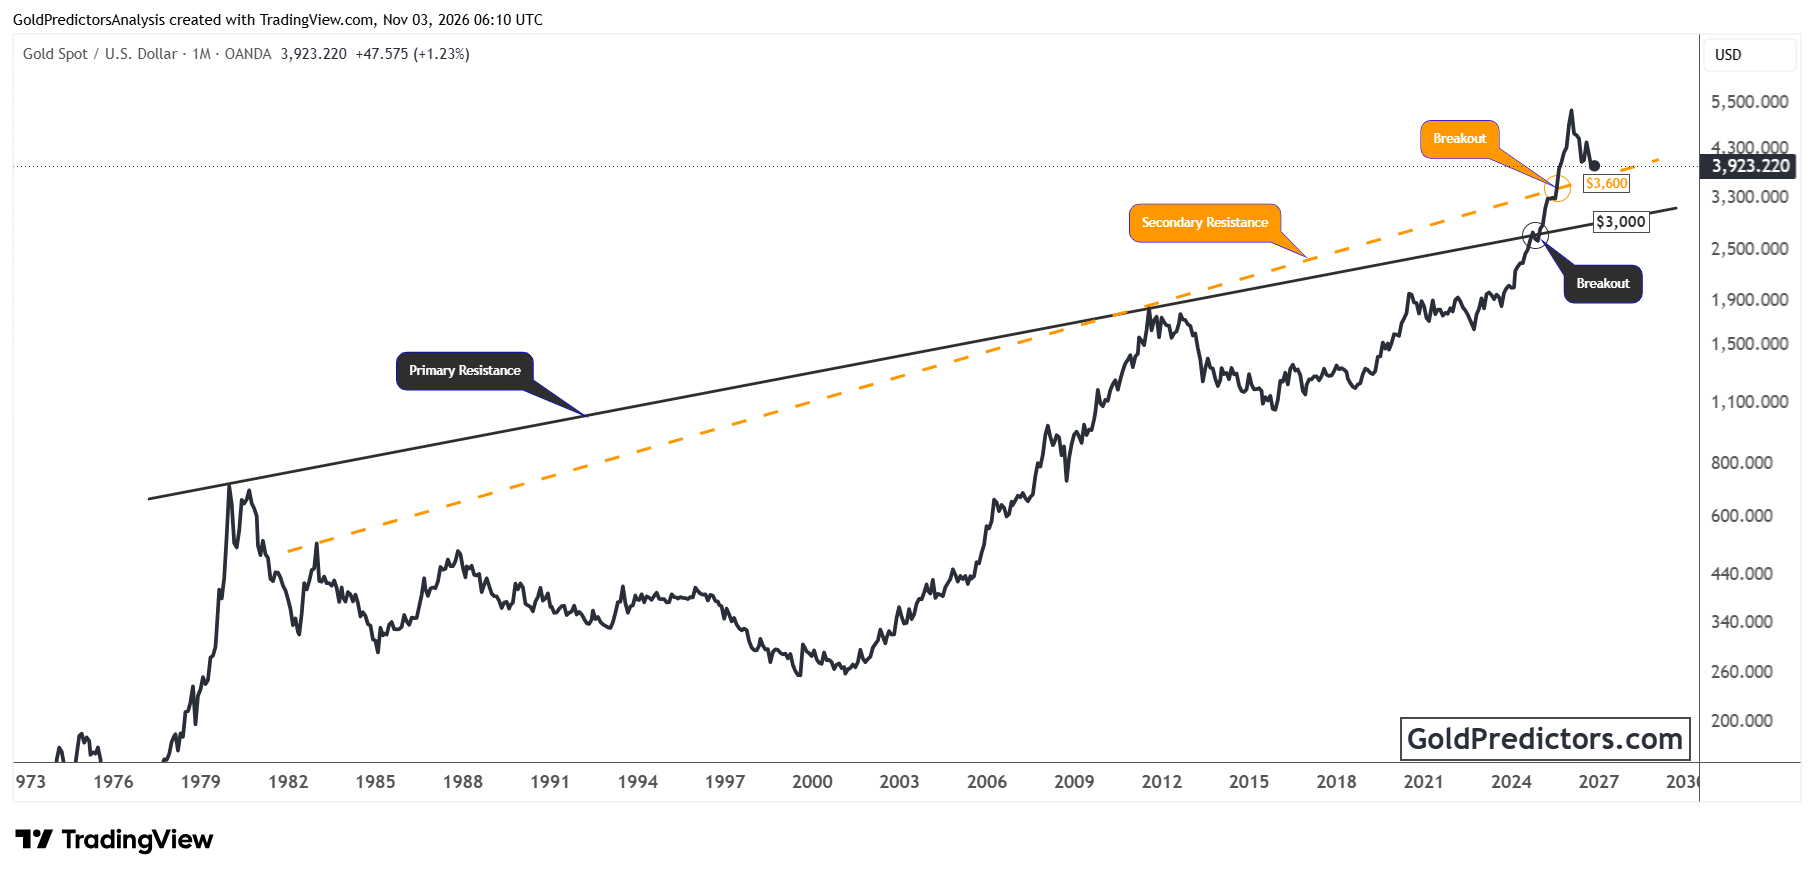
However, the gold price faces another support level before the $3,000 area. This support lies in the $3,500 to $3,600 area. This support is defined by the ascending trend line that stretches back to December 1982. This line is marked by the golden dotted trend line on the chart below. This suggests that if gold prices correct towards the $3,500 to $3,600 area in the short term, they may likely produce a strong rebound. However, a break below $3,500 will likely open the way for a further drop towards the long-term support in the $3,000 area.
Weekly Chart: Gold Risks Further Losses Below $3,900
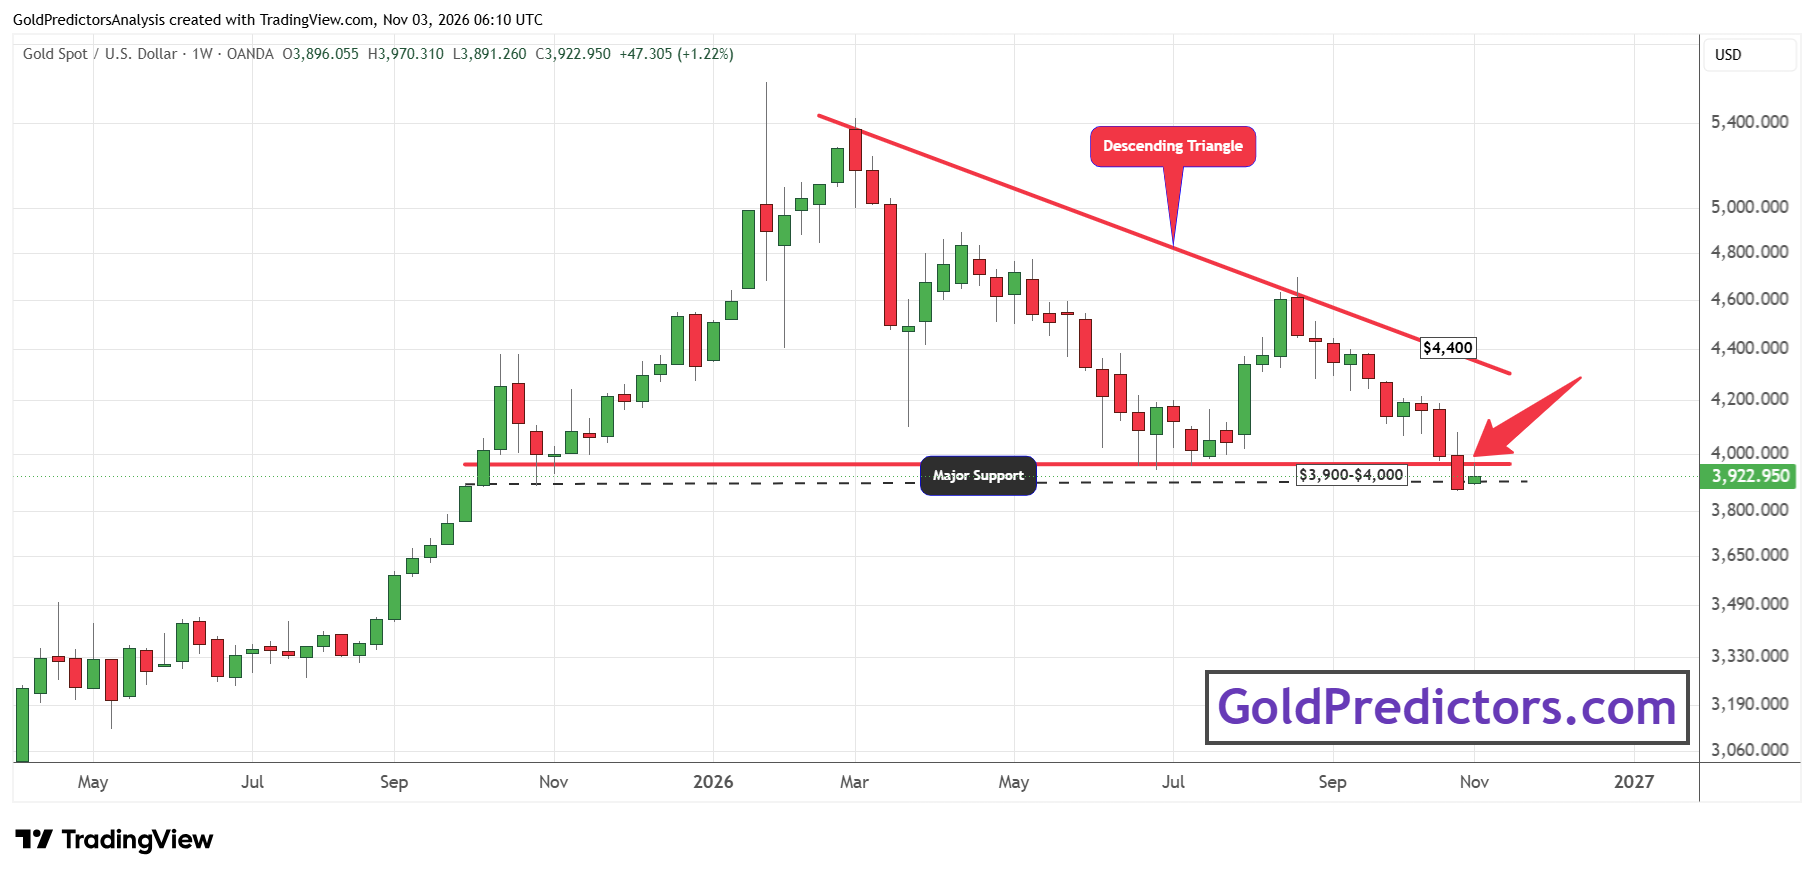
The strong bearish pressure in the gold market is also observed on the weekly chart, which shows the formation of the descending triangle pattern since the highs of January 2026. The descending triangle pattern was broken at the $3,900 area last week as the price closed the week below the $3,900 level. The $3,900 to $4,000 area has been the long-term support zone in the gold market. A break below $3,900 suggests that prices may remain under pressure in the short term.
However, if the gold price produces a rebound and closes the week above the $4,100 area this week, it will likely open the way for further upside towards the $4,400 area. The gold price is required to break above the resistance at $4,400 on the descending triangle, which may suggest a bottom in gold and a continued rally towards the $5,000 level. However, another weekly close below $3,900 this week will likely suggest a deeper correction towards the $3,500 to $3,600 region.
Final Thoughts
Gold remains under pressure as rate hike expectations and investor selling limit its recovery. The correction in oil prices may offer relief but renewed tensions in the Middle East could keep inflation fears alive. Another weekly close below $3,900 would increase the risk of a drop towards $3,500–$3,600.
This support area may attract buyers, but a break below $3,500 would bring $3,000 into focus. A weekly close above $4,100 could support a recovery towards $4,400. I think that the gold price needs weaker rate hike expectations and calmer equity markets to build a lasting rebound.
Comments
Log in or sign up to join the conversation.