

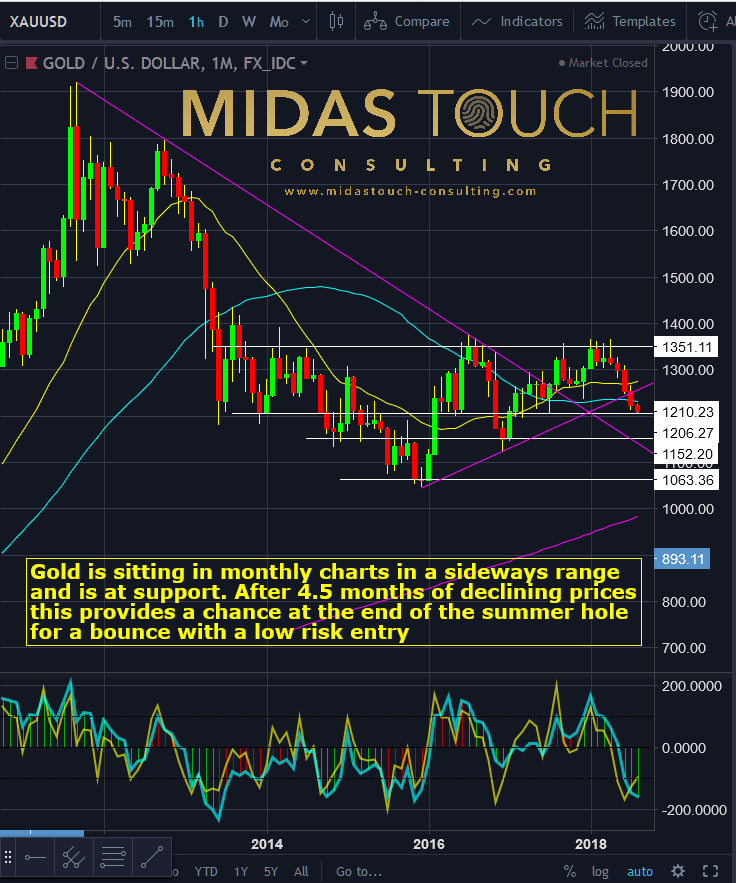
Gold monthly chart, August 12th 2018. In a sideways range at support.
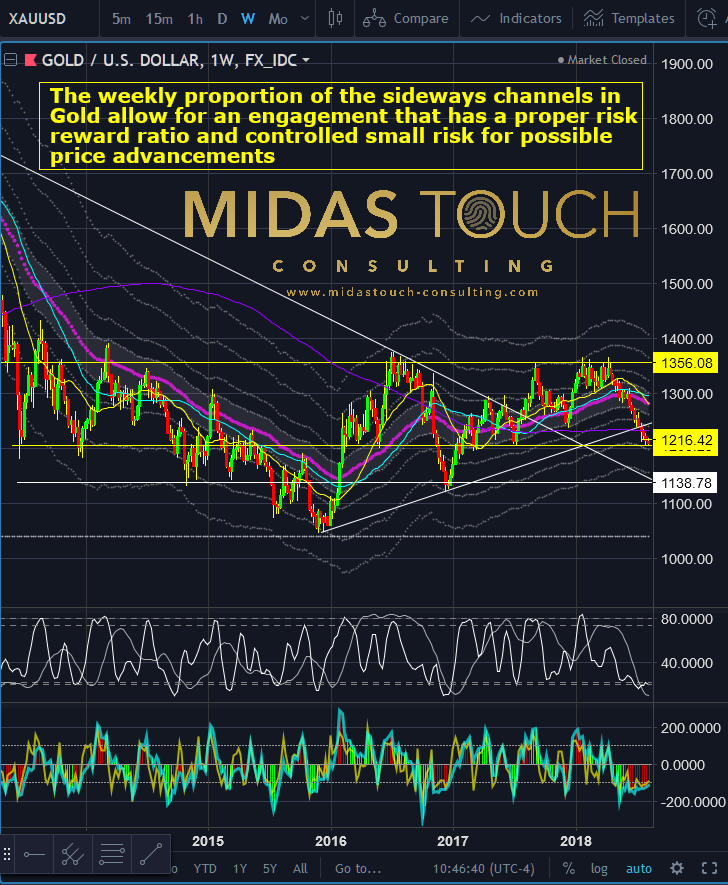
Gold weekly chart, August 12th 2018. Engagement with proper risk/reward-ratio.
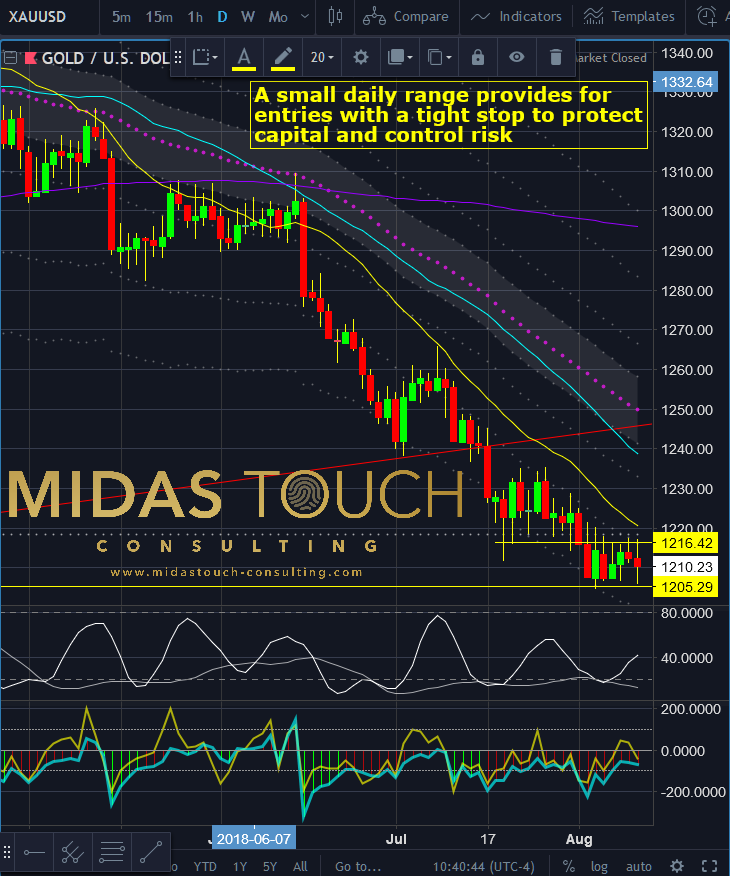
Gold daily chart, August 12th 2018. Entry with tight stop.
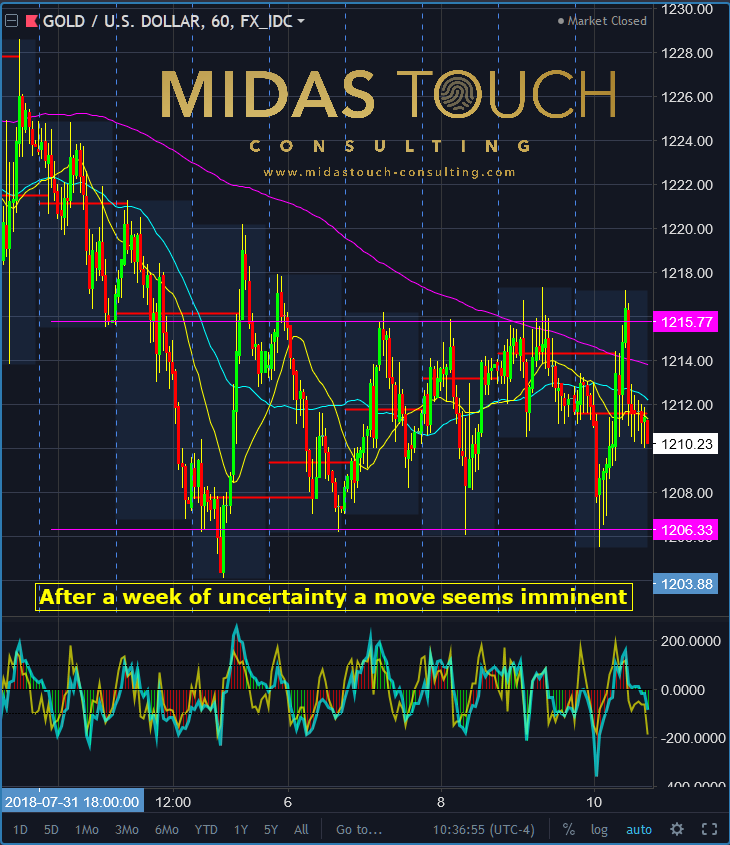
Gold hourly chart, August 12th 2018. A move seems imminent.
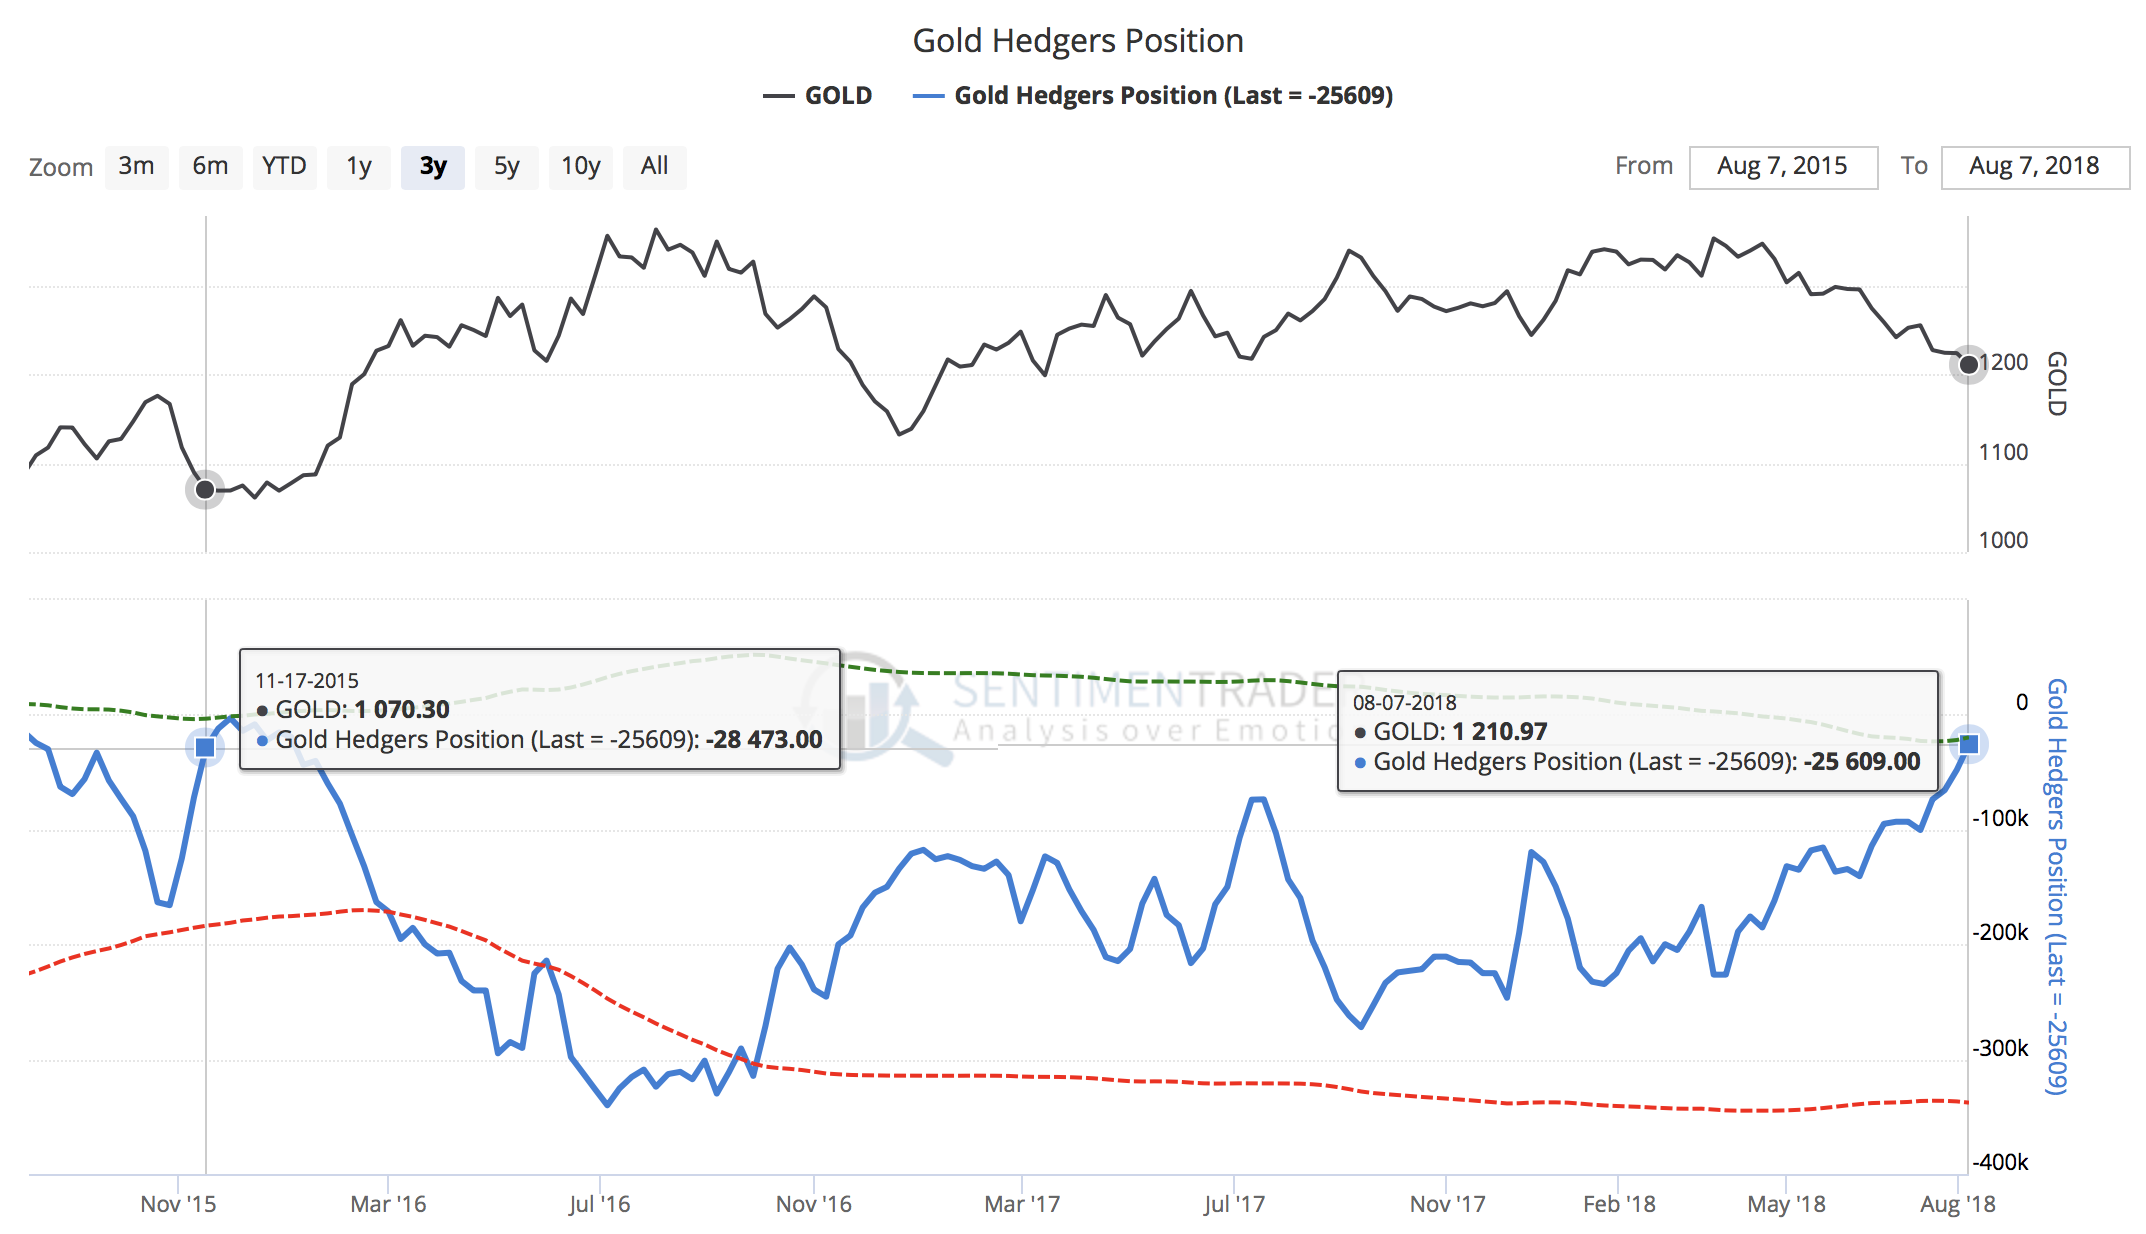
Gold CoT-Data, commercial short position at lows last seen around the lows at 1,000 USD nearly three years ago



Comments
Log in or sign up to join the conversation.