

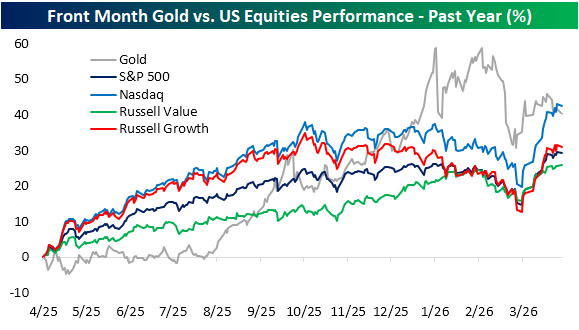
Last year, precious metals were an astoundingly strong trade with some of the strongest performance of any asset. As shown below, as the calendar turned the page, the rally in front month gold has reversed. Over the last year, gold is still handily outperforming indices like the S&P 500, Russell 1,000 Value, and Russell 1,000 Growth. However, the Nasdaq has caught the yellow metal due to a combination of Tech stock's recent strength and the recent weakness in gold.
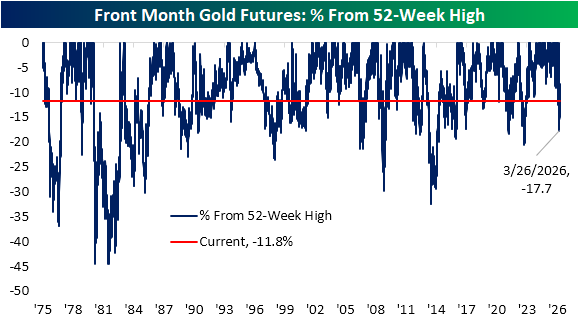
Checking in on front month gold's drawdown, at the worst of the decline on a closing basis, gold fell 17.7% versus its January peak. As shown below, that was the sharply drawdown since late 2022, but is far from the worst declines on record. Further, the metal has rallied back to now be 11.8% from its 52-week high. That is only a few percentage points worse than the historical average drawdown (-9.9%).
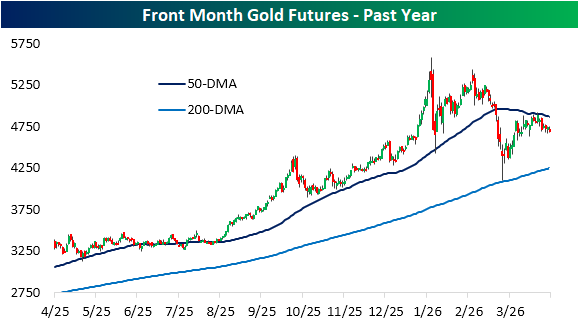
As shown below, gold peaked in late January and after successfully testing support at its 50-DMA intraday on February 2nd, it quickly moved higher to retest prior highs within the next month. That run to new highs was unsuccessful though as gold has lost its glitter. The metal closed below its 50-DMA by March 18th (the first instance since August 21, 2025) and continued lower throughout the back half of the month. Similar to the early February intraday test of the 50-DMA, on March 23rd, gold tested its 200-DMA. While it never closed below, the rally higher since then has stalled as it re-addressed the 50-DMA which is now trending lower.
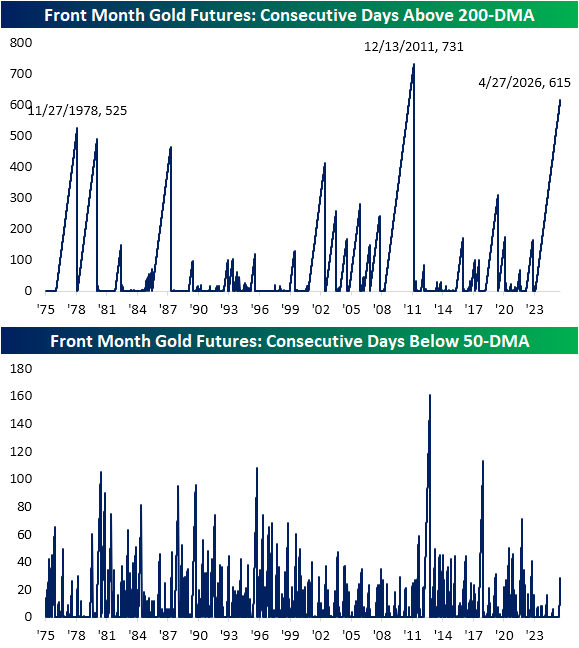
Again, last month gold never quite fell below its 200-DMA on a closing basis. As a result, the metal has kept alive the second longest streak of closes above its 200-DMA on record: this streak is now at 615 straight trading days, meaning the last time gold closed below its 200-DMA was on November 10, 2023. Ironically, while this streak is still alive and well (gold would need to fall over 10% to return to the 200-DMA), it has also been on a growing streak of closes below its 50-DMA. As shown in the second chart below, gold has been below its 50-DMA for 28 straight days, the longest since a 41-day long streak ending in July 2023.
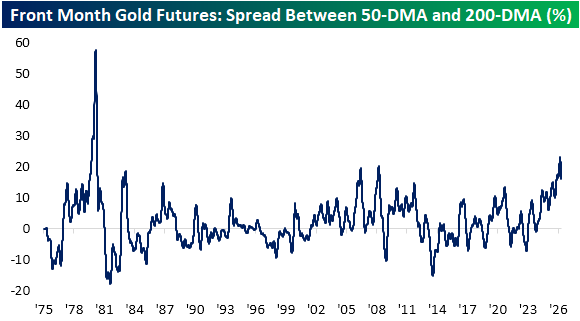
All that is to say that from a technical picture, front month gold has seen a deterioration in its technical picture as it is now sandwiched between support at the 200-DMA and 50-DMA. While those two moving averages will continue to be levels to watch, there is a wide spread between them. As shown below, there's 16% between the two moving averages, and one month ago that spread was over 20%. The only other times this spread has been wider was 1980, 1983, 2006, and 2008.


Comments
Log in or sign up to join the conversation.