


Gold and silver have attracted considerable investor attention, and for good reason. Worries over inflation, high energy prices, levels of government borrowing and the outlook for interest rates have kept precious metals firmly in focus. The US dollar may weaken in the coming weeks because the Democrats’ control of both chambers of Congress could create political gridlock, limiting further fiscal stimulus and reducing support for US yields and dollar demand as we approach the end of 2026.
There is an interesting relationship here. If investors become increasingly concerned about fiscal credibility or the purchasing power of currencies, demand for precious metals could strengthen. Equally, if buying returns to the US Treasury market in earnest and real yields begin to fall sharply, the opportunity cost of holding non-yielding assets such as gold and silver could become less significant.
But there is still another important reason to pay attention to precious metals right now.
Both gold and silver are approaching historically favourable seasonal periods.
And when we compare their seasonal patterns, the results reveal some important differences that could help investors decide not only which metal to watch, but also when to consider an entry.
Gold’s seasonal strength begins in November
Let’s start with gold. Using Seasonax to examine the last 10 completed seasonal periods, gold has produced an impressive average return of +11.69% between 11 November and 18 April. Even more importantly, gold gained during this period in nine of those 10 years, giving the pattern a 90% win rate. The median return was also strong at +10.17%, suggesting that the historical performance has not simply been driven by one exceptional year.
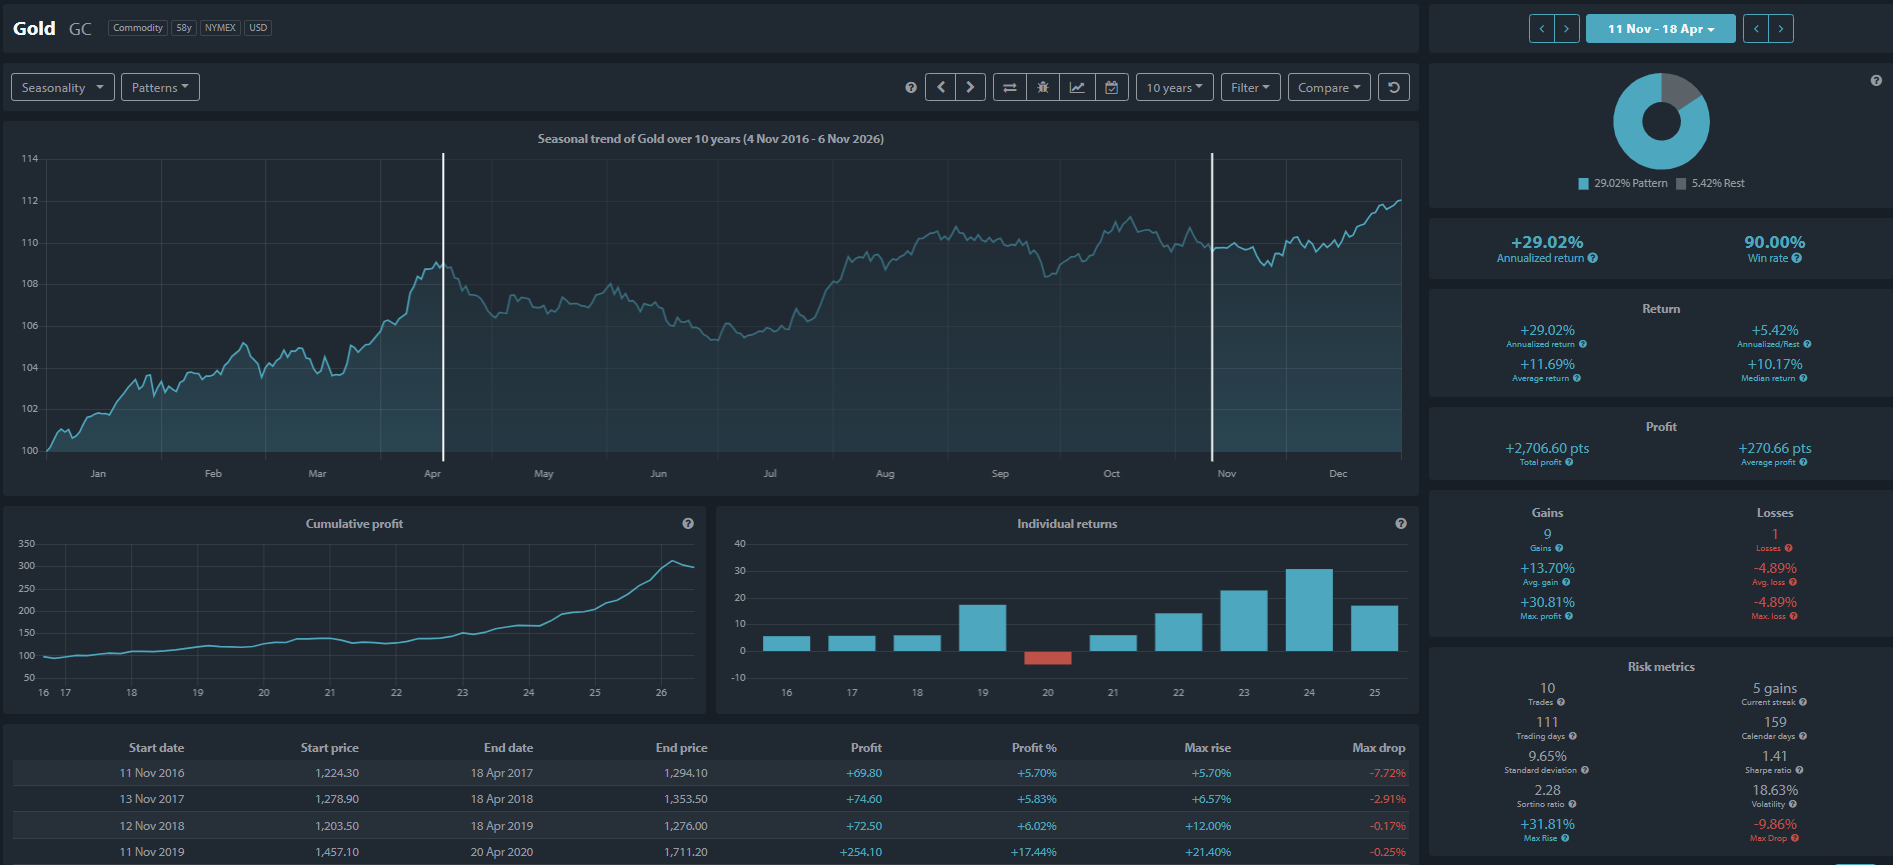
Gold, 11 Nov to 18 Apr: 9 of the last 10 periods ended higher, for a +29.02% annualized return. Seasonax | View data
The seasonal curve is particularly interesting. Gold has historically experienced some weakness during November before beginning to strengthen towards the end of the year. That strength has often continued into the first quarter, with the seasonal pattern showing a particularly favourable period through the early months of the year.
This creates an interesting opportunity for investors considering a longer holding period. Rather than focusing exclusively on a December entry, the historical data suggests that November may provide an opportunity to begin watching for a favourable entry ahead of the stronger seasonal months.
However, gold is not the only precious metal showing an attractive seasonal tendency.
Silver offers a similar opportunity, but with greater volatility
Over exactly the same period, from 11 November to 18 April, silver has also produced some impressive historical results. Across the last 10 completed observations, silver delivered an average return of +11.10%, with gains in nine of those 10 years. That represents the same 90% win rate as gold.
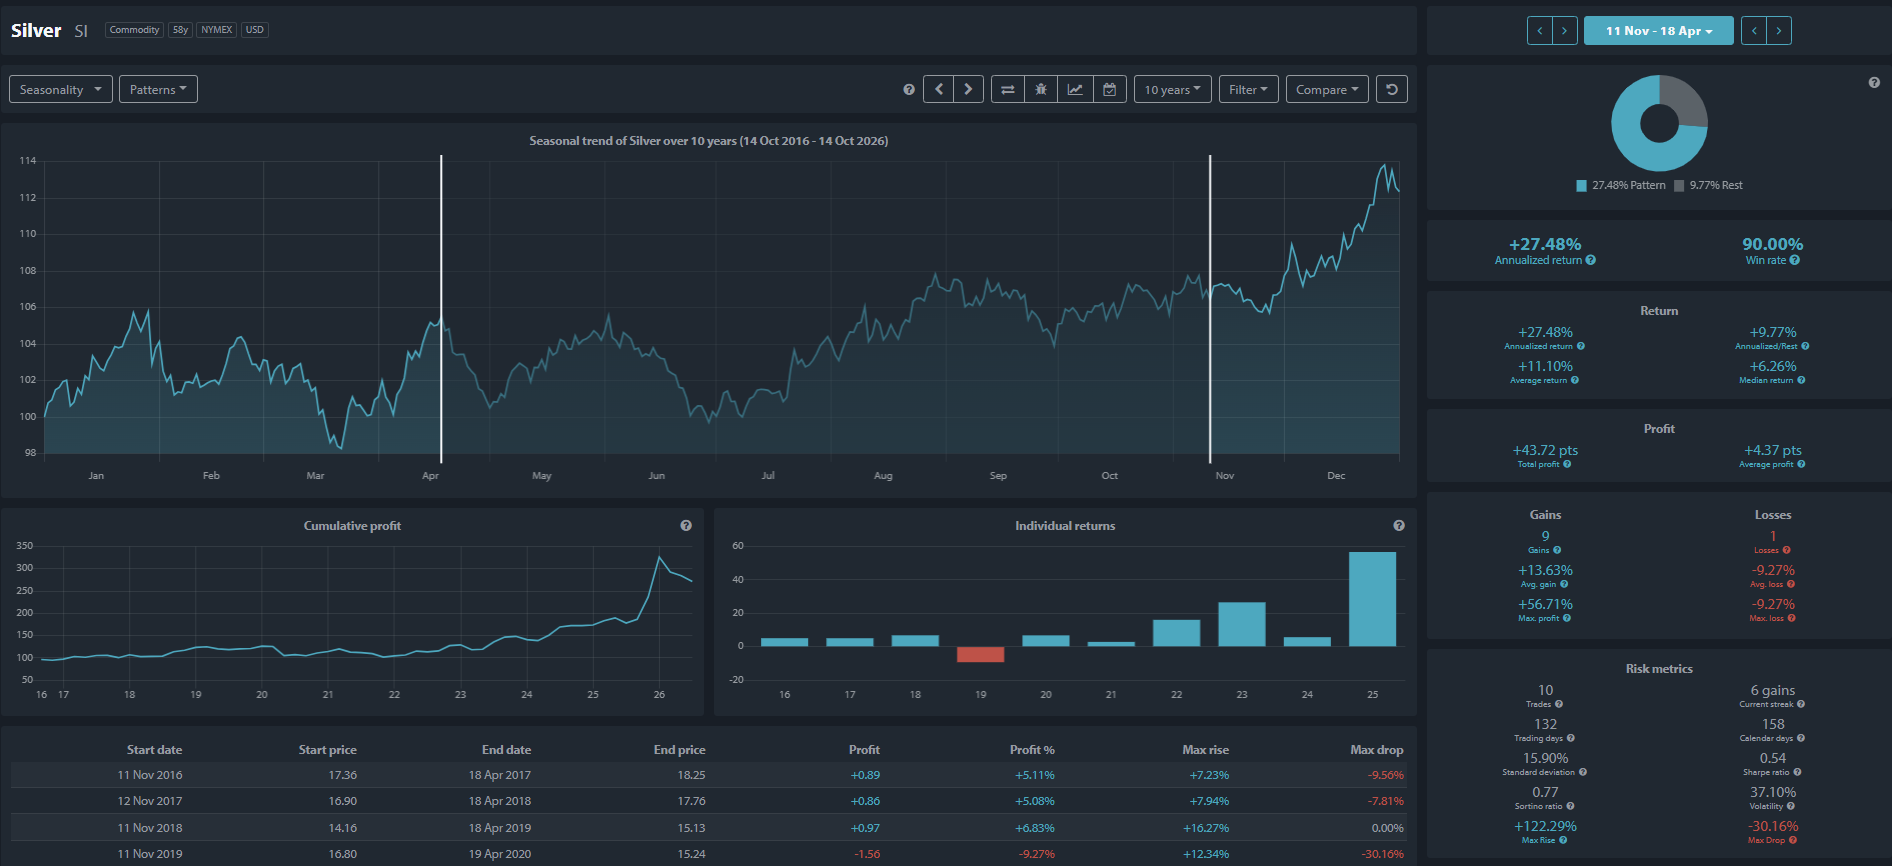
Silver, 11 Nov to 18 Apr: a single +56.71% year pulls the +11.10% average far above the +6.26% median. Seasonax | View data
At first glance, the two metals look remarkably similar. Gold’s average return of +11.69% is only slightly ahead of silver’s +11.10%. However, a closer look reveals an important difference. Silver’s median return was +6.26%, compared with gold’s +10.17%. This suggests that gold’s historical returns have been more consistent, while silver’s average has benefited from some particularly large winning years.
That distinction matters. Silver is generally more volatile than gold because it is influenced by both investment demand and industrial activity. Its role in electronics, solar energy and other industrial applications means it can respond more sharply to changes in global economic expectations.
For investors seeking exposure to the precious metals market, gold has historically offered the more consistent return during this particular seasonal window. Silver, meanwhile, has demonstrated the potential for larger individual gains, but also greater volatility along the way.
Which metal has the stronger winter seasonal window?
There is another way of looking at the opportunity. Rather than entering in November and holding through April, what happens if we focus on the shorter and historically stronger winter periods for each metal?
For gold, the Seasonax data shows that between 13 December and 20 February, the metal has produced an average return of +6.68% over the last 10 years. Gold gained in nine of those 10 years, giving the pattern a 90% win rate. The median return was +6.83%, reinforcing the consistency of this particular seasonal window.
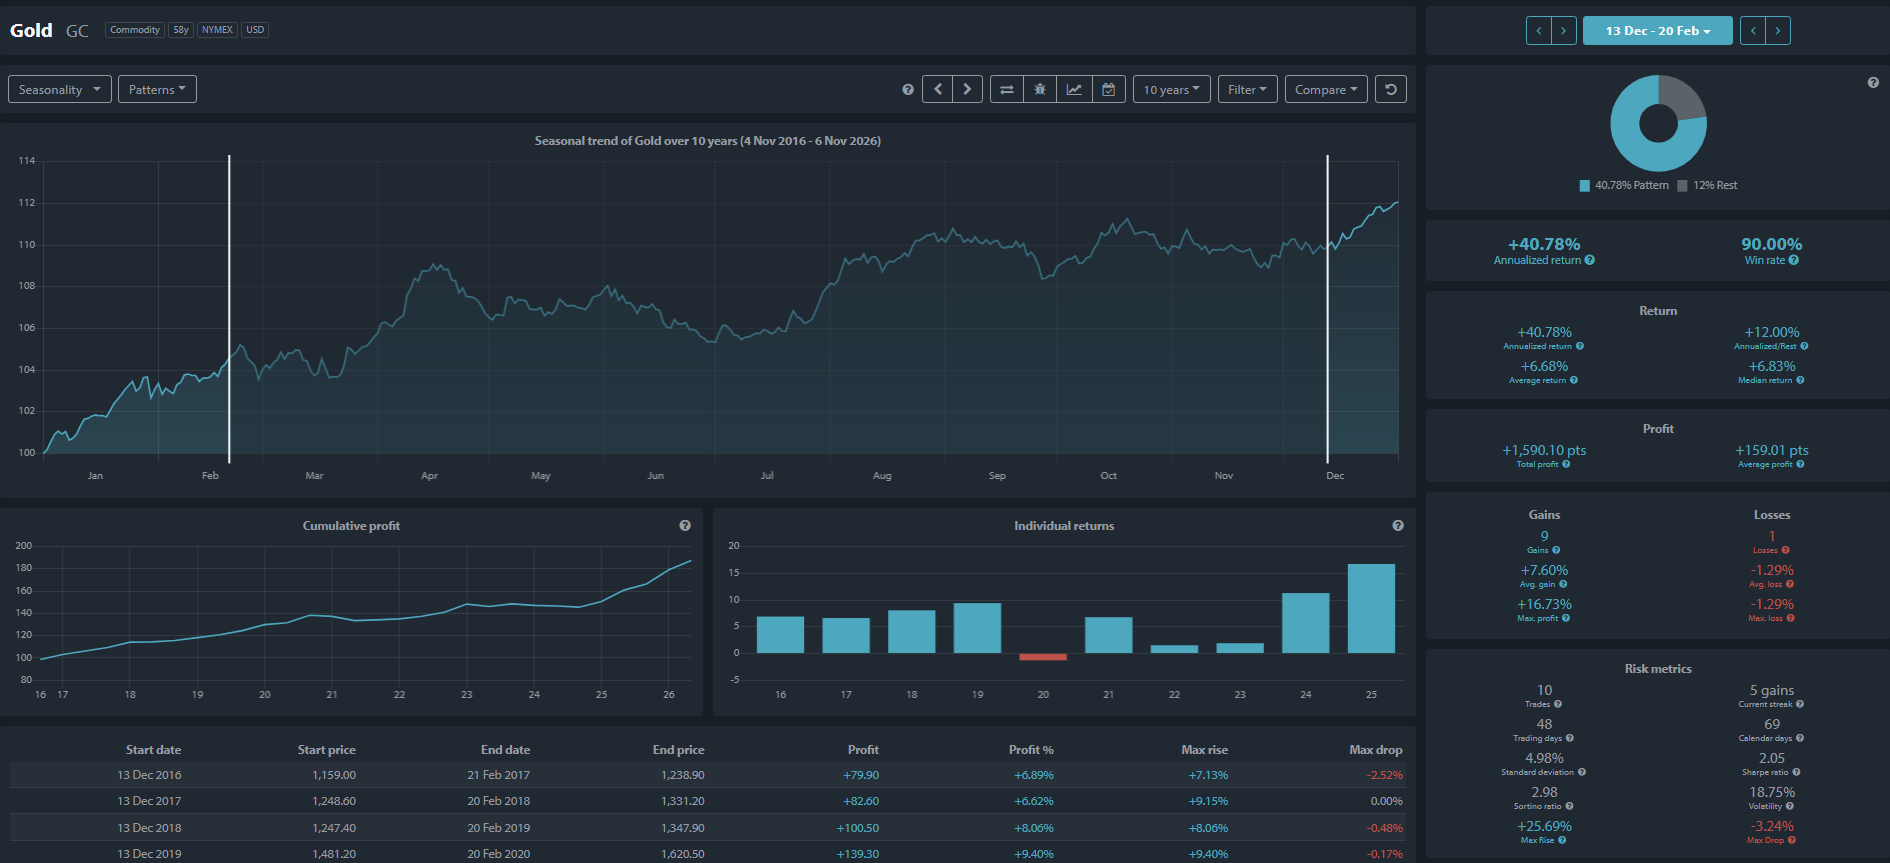
Gold, 13 Dec to 20 Feb: a 4.98% standard deviation points to a tight spread, and the only loss was -1.29%. Seasonax | View data
Now compare that with silver. Between 11 December and 29 January, silver produced an average return of +9.20%, again with gains in nine of the last 10 years. That is a higher average return than gold’s, despite silver’s seasonal window being shorter.
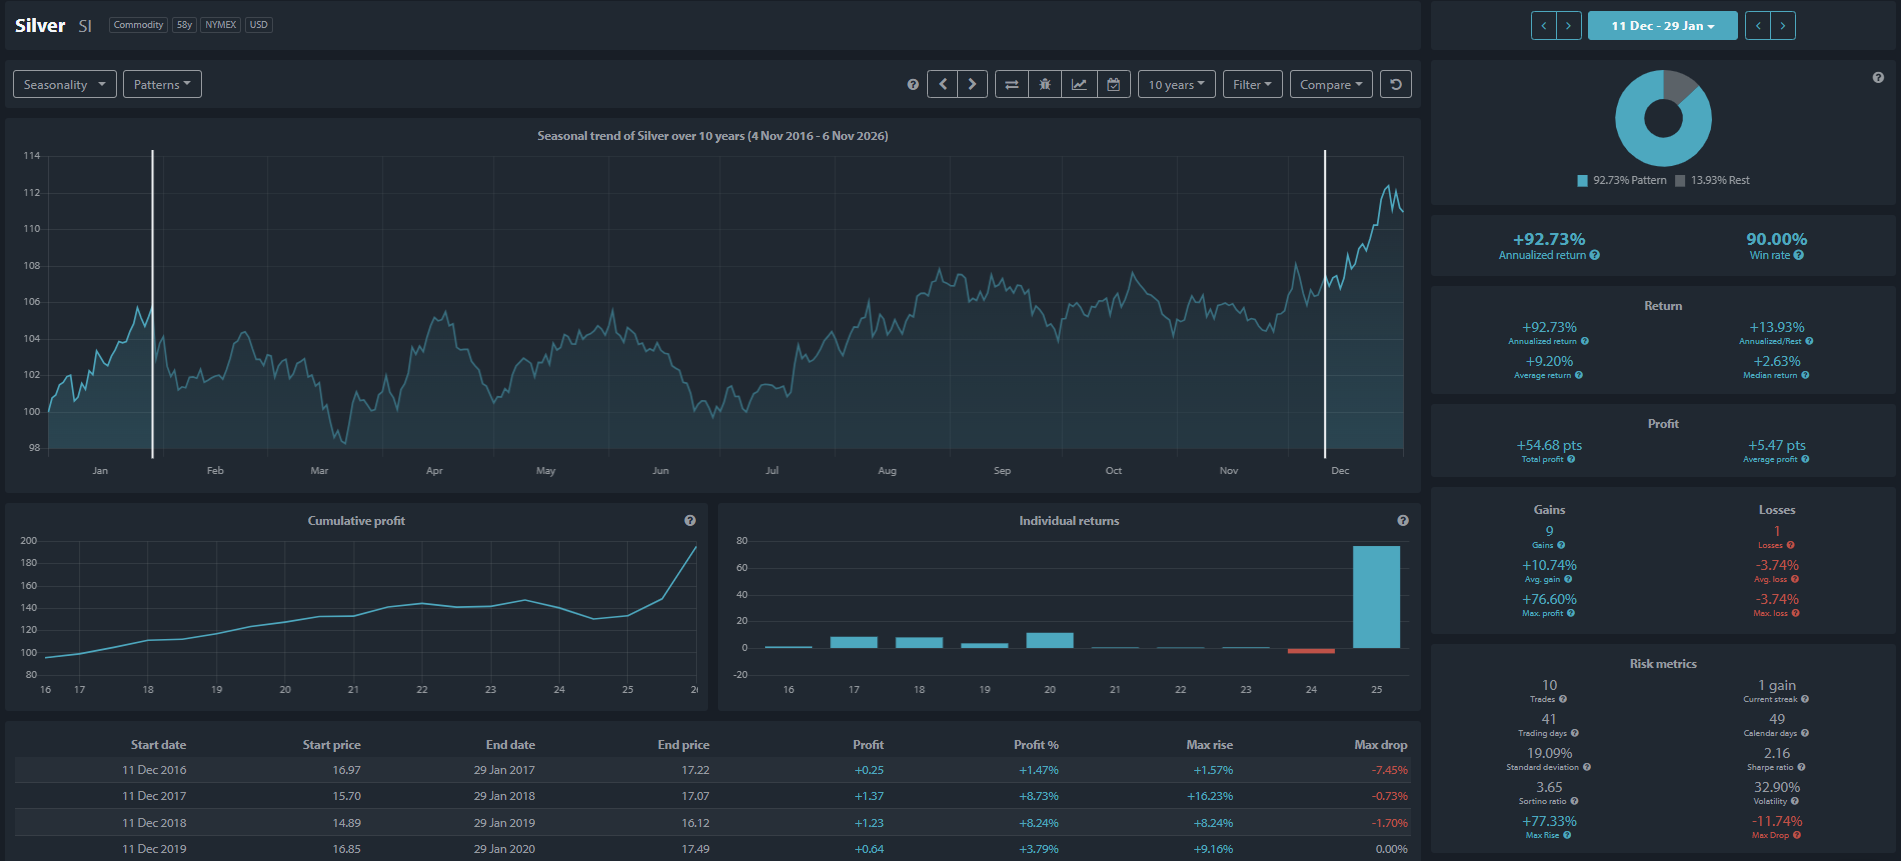
Silver, 11 Dec to 29 Jan: the 2025 window gained +76.60%, dwarfing the other 9 results and leaving a +2.63% median. Seasonax | View data
However, the median return tells a rather different story. Silver’s median gain was just +2.63%, compared with gold’s +6.83%. Silver’s results also included one exceptionally strong period, last year, with a maximum seasonal-window gain of +76.60%. That single observation has significantly influenced the average.
This is an important distinction. Silver has delivered the higher average return during its shorter winter window, but gold has produced the stronger typical result. Investors should therefore be wary of the mistake of assuming that silver’s higher historical average automatically makes it the better opportunity.
November entry or December entry?
So where does this leave investors?
The longer seasonal studies suggest that both gold and silver have historically offered attractive opportunities from November through April, with average returns above 11% and a 90% win rate for each metal.
However, the shorter winter studies reveal something equally interesting. Gold has historically offered a relatively consistent seasonal opportunity from mid-December through February, while silver has demonstrated greater upside potential between December and late January.
That does not necessarily mean investors should buy immediately in November. The longer seasonal windows include several additional months of market exposure, so their higher cumulative returns do not prove that entering earlier is always preferable.
Which precious metal would you choose?
The seasonal data presents an interesting choice. Gold has offered more consistent typical returns during its strongest winter window. Silver has offered greater upside potential, but with significantly higher volatility and a greater reliance on exceptional winning years.
Both metals have produced positive returns in nine of the last 10 completed observations across their respective seasonal windows. As we approach the end of 2026, the combination of seasonal strength, inflation uncertainty, fiscal concerns and potential changes in Treasury yields makes both metals worth watching.
The key opportunity may not simply be choosing between gold and silver. It may be using seasonality to identify when the conditions for a stronger move are beginning to align.



Comments
Log in or sign up to join the conversation.