

Back in May, we highlighted an interesting seasonal setup developing in copper. Copper was entering one of its weakest periods of the year. Over the previous 15 years, the metal had produced an average return of -4.11% between 27 May and 7 August, with gains in just 26.67% of years.
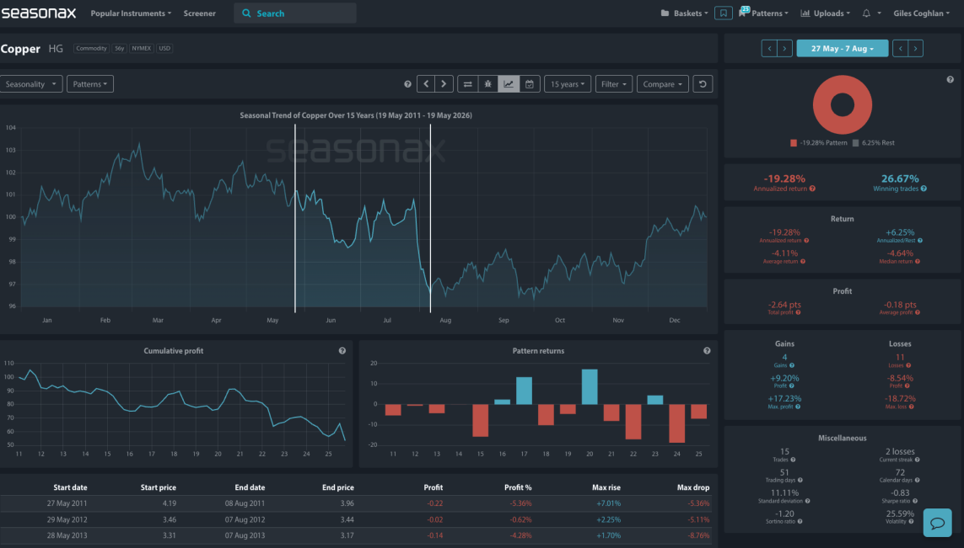
Copper’s summer weak spot: -4.11% on average between 27 May and 7 August over 15 years. Source: Seasonax
However, there was an important twist.
While the short-term seasonal picture looked weak, the longer-term outlook for copper remained bullish. Electrification, AI infrastructure, electricity grid investment and renewable energy were all creating powerful structural demand for copper. Meanwhile, developing new copper supply remains notoriously difficult and time-consuming.
Our conclusion was simple: summer seasonal weakness could provide longer-term investors with an opportunity to buy copper at lower prices.
That seasonal weakness arrived.
And the dip-buying opportunity played out. Copper weakened during the summer before subsequently recovering strongly. This was exactly the type of setup the historical seasonal pattern suggested investors should be watching for.
Now, however, the seasonal picture is changing again.
Copper Is Entering a Much Stronger Seasonal Period
The Seasonax data shows a striking change in copper’s historical performance as we move through August. Over the last 10 years, between 19 August and 31 December, copper has produced an average return of +8.37%. Even more importantly, copper gained during this period in 8 of the last 10 years, giving the pattern an 80% win rate. There have been some particularly strong years.
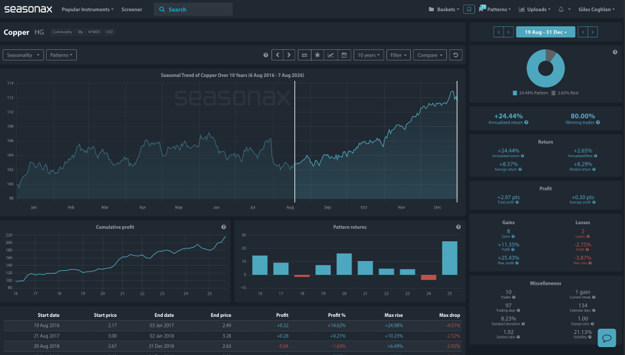
The seasonal turn: +8.37% on average from 19 August to 31 December, with an 80% win rate over 10 years. Source: Seasonax | View pattern
Copper gained 14.62% in 2016, 16.22% in 2020, 10.47% in 2021 and an impressive 25.43% in 2025. So, after the summer weakness highlighted in May, seasonality now begins to turn much more constructive. However, there is another part of the historical data that may be even more useful.
Seasonality Can Help Investors Buy the Dip
A strong seasonal period does not mean prices simply move higher in a straight line. In fact, the Seasonax data reveals something particularly interesting. During this bullish August-to-December window, copper experienced a pullback in 9 of the last 10 years. The only exception was 2021. See the right-hand side of the table below under the Max drop column.
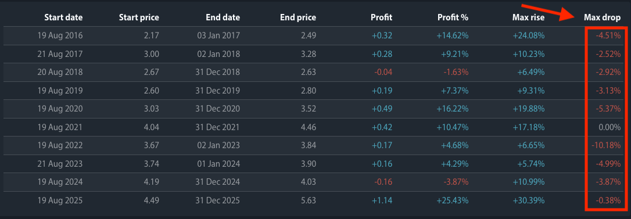
Year by year: a pullback showed up in 9 of the last 10 seasonal windows, even in copper’s strongest years. Source: Seasonax | View pattern
Some of these declines were relatively shallow. Others were substantial. Consider 2022 – Copper ultimately gained 4.68% during the seasonal window, but at one stage suffered a maximum drawdown of 10.18%.
The same principle can be seen during some of copper’s strongest years. In 2016, copper ultimately gained 14.62%, but investors still had an opportunity to buy after a maximum drawdown of 4.51%. In 2020, the eventual gain was 16.22%, yet the maximum drawdown during the period reached 5.37%.
This is where seasonality becomes particularly revealing. Rather than simply telling us that an asset has historically performed well during a particular period, seasonal data can also help us understand how that move has typically developed. And in copper’s case, history suggests that even strong year-end rallies have frequently contained meaningful pullbacks.
Where Could the Next Opportunity Develop?
Copper is currently trading around the $6.60 per pound area, but the technical picture shows an interesting support zone around approximately $5.75 to $6.00. That area also sits close to copper’s rising longer-term trend and around its 50-week exponential moving average. A move from current levels towards $6.00 would represent a pullback of roughly 9%. See the chart below.
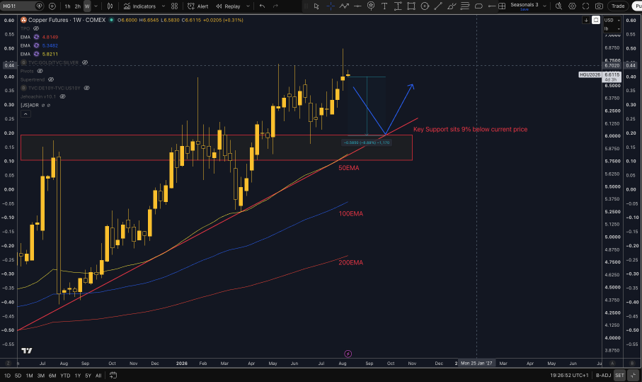
Copper near $6.60, with support in view around $5.75 to $6.00.
Interestingly, that would not be unprecedented during copper’s historically bullish seasonal window. As we have already seen, the maximum drawdown reached more than 10% in 2022 before copper subsequently finished the period higher.
Now, of course, this does not mean copper has to fall to $6.00. Note that the historical data also shows that shallower pullbacks have regularly occurred before further gains. Therefore, investors can use the seasonal tendency alongside technical support to identify potential entry opportunities rather than simply chasing prices higher.
The Structural Copper Story Remains Powerful
There is also a fundamental reason to pay attention to these seasonal pullbacks. Copper is becoming increasingly important to the infrastructure underpinning the global economy. Electric vehicles require substantially more copper than conventional vehicles. Renewable energy requires extensive transmission infrastructure. Electricity grids need enormous investment as economies electrify.
Then there is AI.
The rapid construction of data centres is increasing electricity demand, requiring not only the facilities themselves but also additional generation capacity, transmission infrastructure and grid connections.
The supply side is much harder to expand.
Large copper mines can take well over a decade to progress from discovery and planning through permitting, financing, construction and eventual production. Declining ore grades and rising development costs create additional constraints.
This creates a potential long-term mismatch: copper demand can increase relatively quickly, while new mine supply takes years to respond.
Trade Risks and Opportunities
Of course, the bullish seasonal pattern is not guaranteed.
Copper remains highly sensitive to Chinese economic activity, global growth expectations, the US dollar and changes in investor positioning. A sharper global slowdown could also overwhelm seasonal tendencies. However, that volatility may itself create the opportunity.
The lesson from the historical data is not simply that copper tends to rise into year-end.
It is that pullbacks have occurred in 9 of the last 10 years during this otherwise bullish seasonal window.
That gives investors a potentially valuable framework.
The summer dip highlighted in May has already played out. Now seasonality is turning stronger, the structural copper story remains intact, and history suggests that another pullback could offer investors a potential entry point into the year-end seasonal trend.
Sometimes the best use of seasonality is not simply knowing what to buy. It is helping you identify when to buy the dip.


Comments
Log in or sign up to join the conversation.