


Gold and silver continue to be mired in a now maturing correction
It has been a long slog since the expected correction began (on the January 29th spike and reversal) from a strenuously overbought situation in the gold, and especially silver, market. That was the dumbest and most FOMO’ing at the mouth money surging into the market.
Gold and Silver Price Technicals
The daily chart shows a falling wedge (bull flag of minor importance, as is most “pattern recognition”) * and an in-progress test of support at the June-August lows. It also shows a 62% Fibonacci retrace of the most intense legs of the 2025 bull move. This is biased positive for a bounce at least.
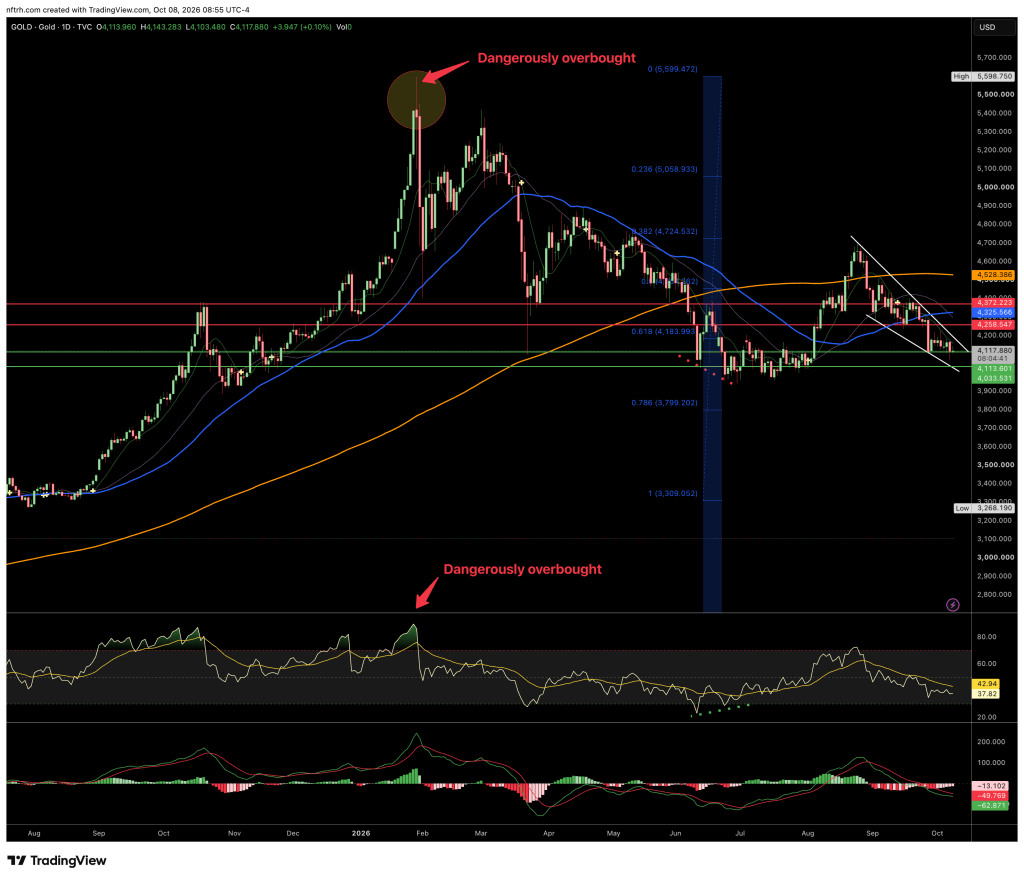
* All due caveats about TAs staring at charts and mystifying you with technical sounding phrases like “pattern recognition”. Like, ‘I recognize that pattern I learned in TA 101!’ Awesome, good for you.
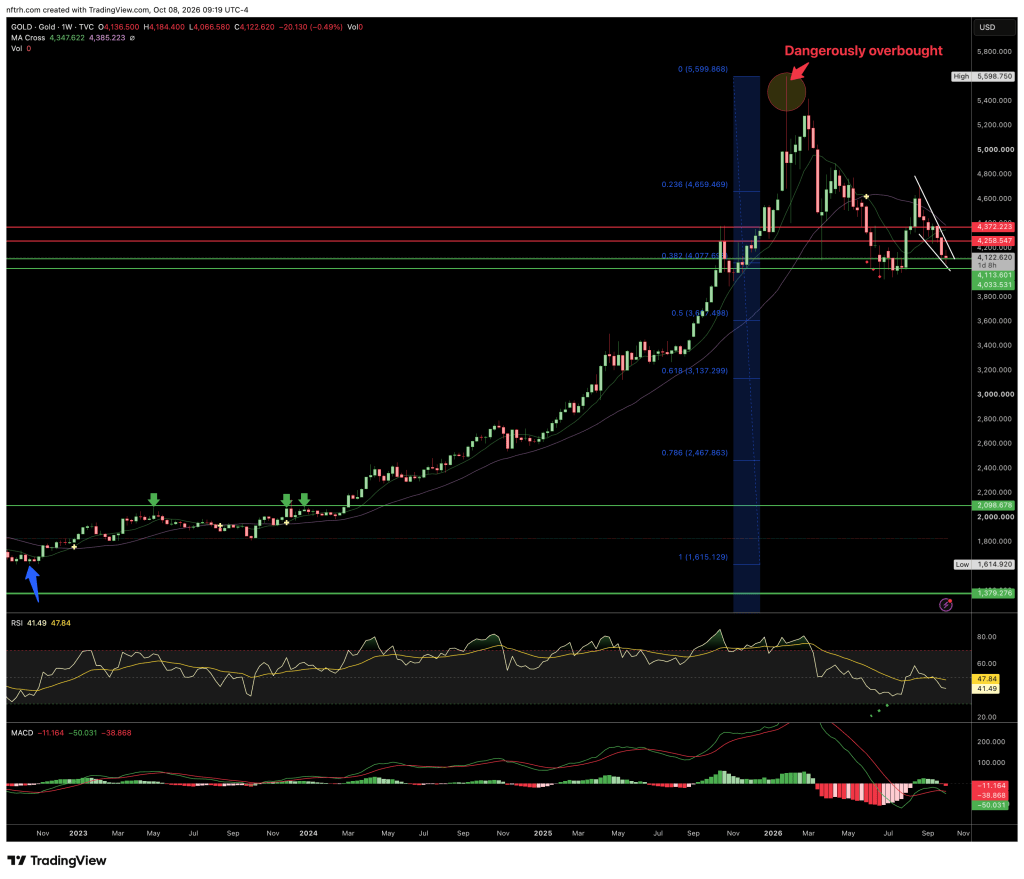
However, the weekly chart plots a Fib grid from the beginning of the longer-term bull move at the 2022 lows. Here we find the gold price having Fib’d 38%, which is all the downside necessary if this is a continuing bull market cycle.
If it is not that and instead a cyclical bear within the secular bull, the 62% Fib yawns at 3137, below a support cluster in the 3260-3400 range. There is no visual technical support at the 50% Fib, which resides at 3607.
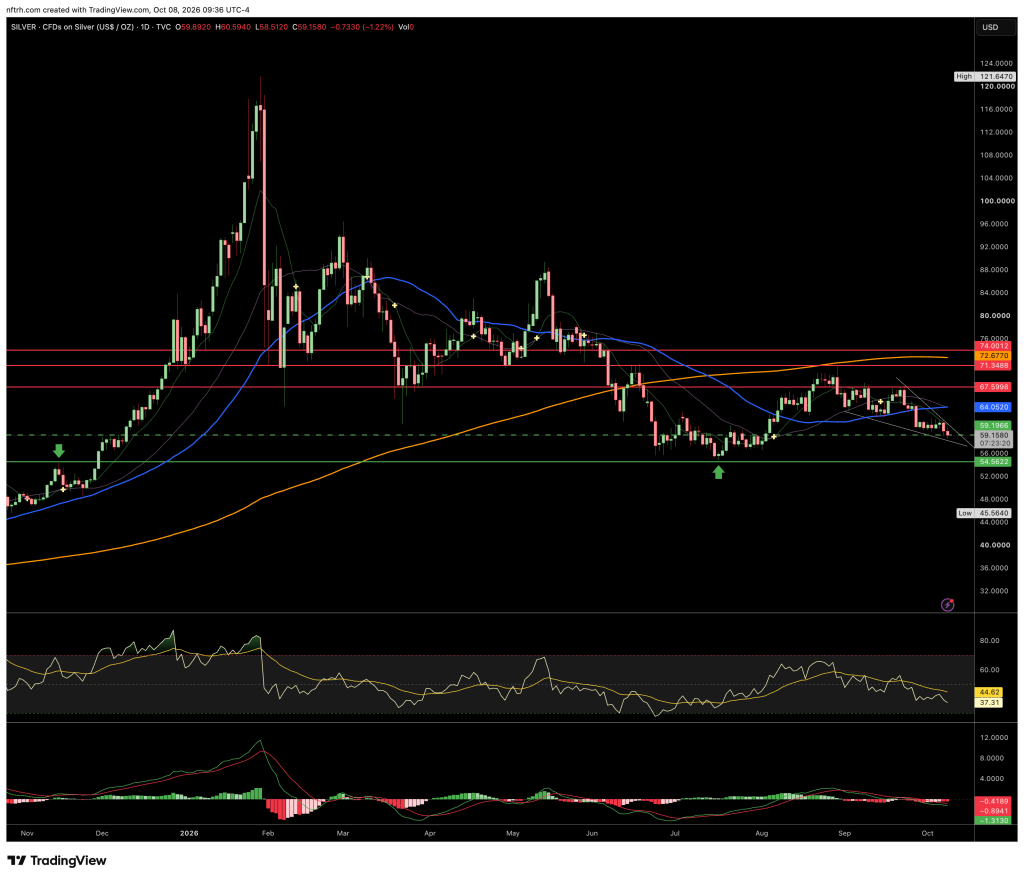
I have not included a daily chart Fib grid on the silver price because the tank job out of the January high tore apart the 62% Fib and the silver price proceeded even lower over the 2026 grind to the July low. As you can see, silver is now at a support area that would be key to making a higher low to that July low of 54.77.
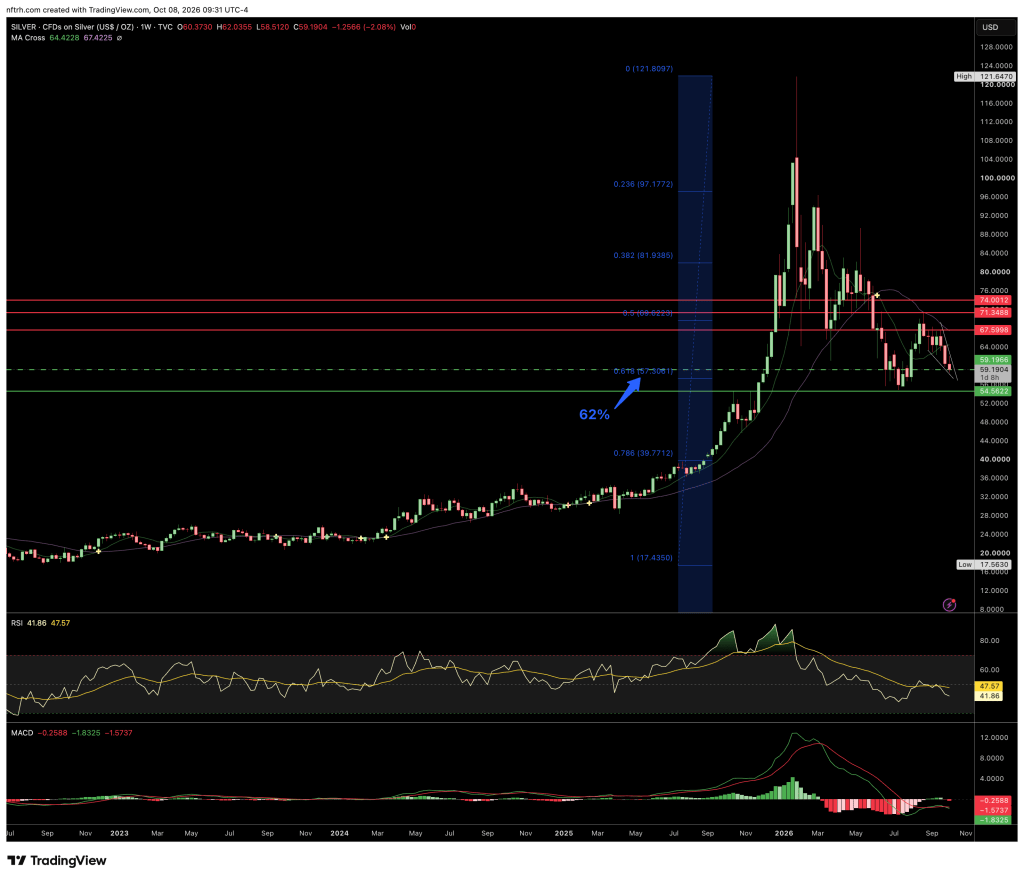
The weekly chart advises that silver is testing those lows at around a 62% Fib retrace of the 2022 lows.
Both metals have done excellent corrective work that was much needed (as I belabored in Q4, 2025/Q1 2026), and are set up to bounce at any time. The main concern I have, outside of current fundamentals, is that neither metal has taken an oversold washout. That may be a function of the bull market (as opposed to bear market oversold readings), or such a washout could still be ahead.
Speaking of Fundamentals
I’ve written about them quite a bit. Mainly in the form of, shall we say intuition (or tin foil hat signals) that Bessent and Warsh are playing good cop/bad cop to engineer a Goldilocks macro. That is where the bad cop on the short end, Warsh, maintains a hawkish stance and the good cop on the long end, Scott “I am the house” Bessent does what he can to suppress those all-important yields.
US bonds selloff eases, yields off highs, after strong 10-year note auction
The favored result would be a flattening of the yield curve, or at least a heavy moderation of its steepening. A sort of Operation Twist-lite, rather than the previous “bear” steepener, which was all about a lack of confidence in these United States of America (though the public thinks “inflation”, which it is not).
As you can see, the good cop/bad cop routine is not working so well thus far as a move toward a ‘bear steepener’ (nominal yields rising) is still in effect. If the curve takes out the two previous highs, it’ll probably see gold’s correction come to an end.
If it re-flattens, bull flattener/Goldilocks style, at best the precious metals may be an also-ran in a wider-spread broad risk-on market rally. There are of course other options, but these are favored.
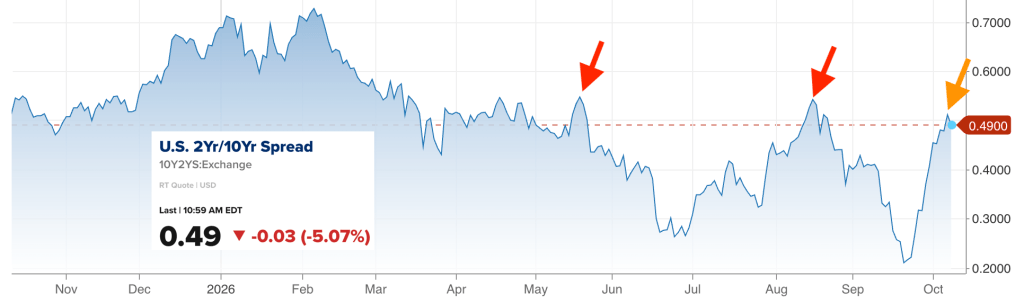
cnbc.com (my markups)
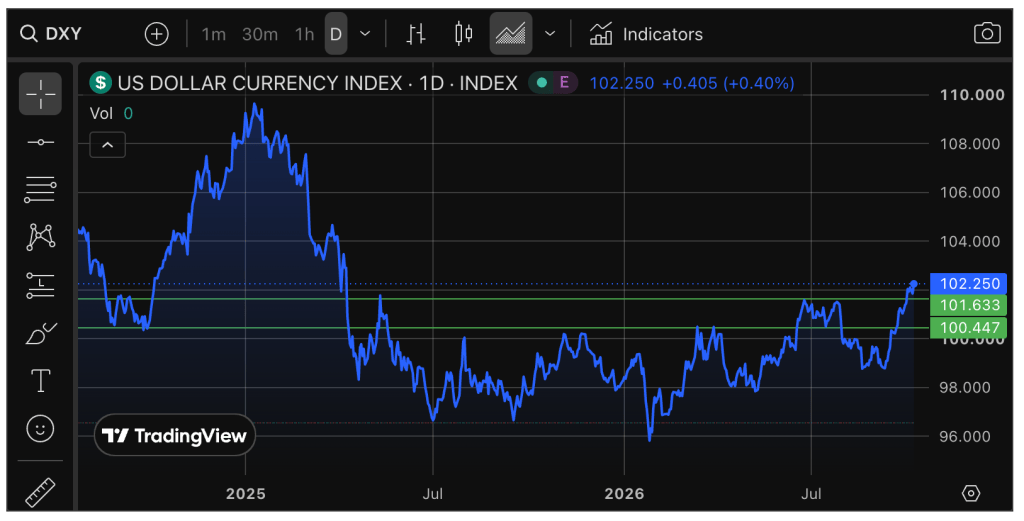
So a Goldilocks curve flattener, barely still in effect, is one negative fundamental. A stronger fundamental negative for the precious metals has been the rise in “real” yields, which along with the Fed’s hawking on the Funds Rate has supported the US dollar.
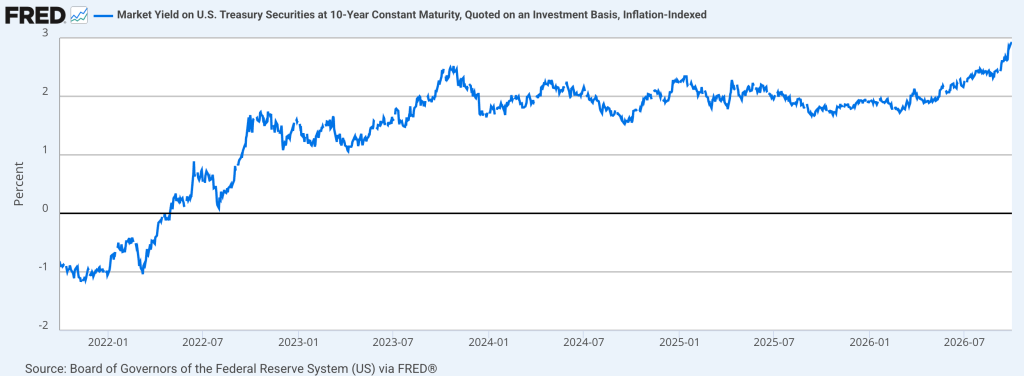
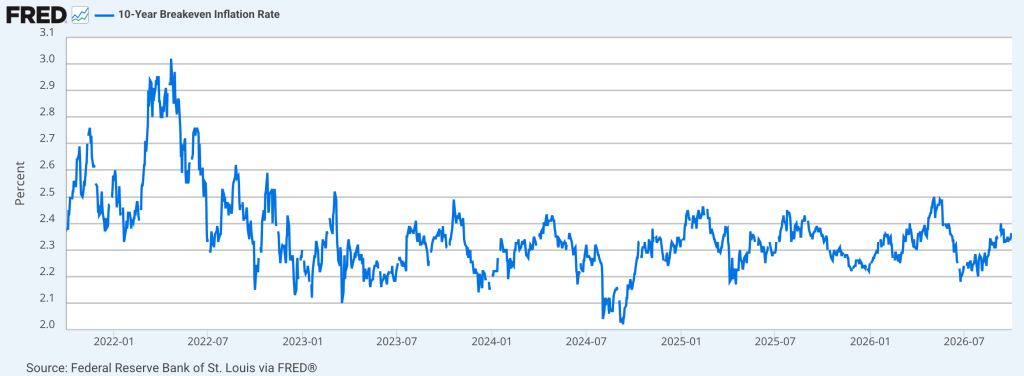
That along with this picture of inflation not really being the problem the headlines say it is.
Uncle Buck likes it all just fine so far. NFTRH carries a long-term view much different than this bullish short-term picture, as USD breaks out of its base. But we are in the moment, and that moment is within the run-up to an all-important, divisive and dynamic election season.
But the macro has been engineered this way. Whether the bond market’s yield rebellion and its ramping real yields forced that engineering or not. Policymakers are reacting to it and that reaction is in an effort to support US Treasury bonds, i.e. the full faith and credit of the US government (a morbidly hilarious notion).
Bottom Line
Gold and silver are firmly in correction, while doing excellent work to refresh for the next bull market rally. Technically, critical support levels are being tested.
I believe that the short-term nature of dynamic political events (mid-term elections and the would-be after-effects on Trump’s cult) and anti-gold market reactions will abruptly change in the coming weeks.
However, don’t let the perma-pumps fool you. The fundamentals, taken at face value, suck right now. That’s the best and most highly technical word I can conjure.
It has been beneficial for all of 2026 to have balance. Personally, that took the form of taking puts on silver into the crash (success), and hedging gold stocks along the 2026 correction (with spotty results at best, if profit-taking is weighed as a goal of hedging).
But more than that, NFTRH has carried a balanced view for all of 2026 across not only the precious metals, but several other market sectors. For example, that now even includes longer-term Treasury bonds. I am long 7-10yr Treasury for a trade in US debt because I think the situation got oversold into a contrarian setup. This is the furthest thing from an investment.
Speaking of investment, the closest thing to it – no matter what its assigned price does going forward – is an investment in macro risk management. In other words, gold. That applied during the dark years for its price (the Op/Twist Goldilocks flattener years of 2012-2019) and it applies now, in the midst of a secular gold bull market.

Comments
Log in or sign up to join the conversation.