

The Short-Term Trend
The short-term downtrend continues. Below is a picture of the PMO index and the trend changes over the past six months. Since July, the PMO index has been choppy and the short-term trend has been difficult to assess using this indicator. However, the last three days of last week show a decisive decline in the index, thus confirming the downtrend.

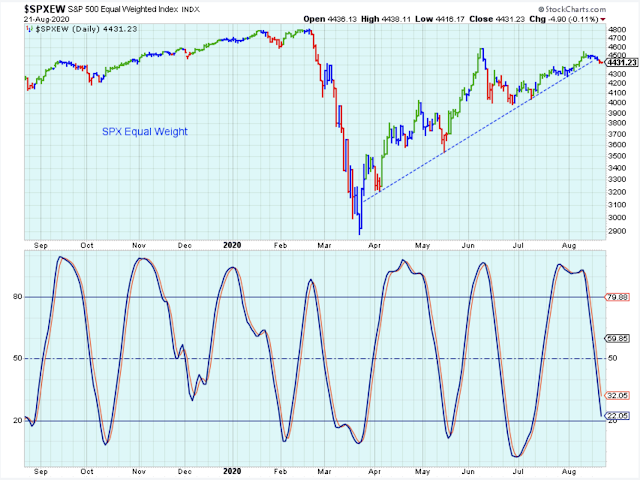
At the moment, a better view of the short-term ups and downs of the market is provided by the basic stochastic of the SPX equal weight shown below. This indicator is working quite well at the moment.
The chart basically signals to get a little more aggressive with stock purchases at the bottom of the range and to raise a little cash at the top of the range. In the short-term, I don't think there is more to it than that, or, stated more accurately, I don't believe this particular chart tells us anything more than that.
In a week or two, it will be time to start thinking about deploying cash again as long as you feel confident that the larger trend remains upward. The larger trend is the key, of course, and you need other charts for that purpose.

I showed this chart last week, and I am showing it again because I am so amazed by it. This is a one-year view of the chart above and it shows that the entire COVID-related market sell-off fits well within one typical short-term down cycle. Did we even have a bear market?
Here is a look at the Call/Put ratio, and it is pointing lower. It's a good signal that the market has turned cautious short-term. It seems like this is a late signal, though, and a bit out-of-sync with the other short-term indicators that had already turned lower. Also, the series of lower highs most likely reveals that some broader market fatigue is setting in.

If you are a regular reader, you know that I often say that a short-term downtrend has to start with the SPX closing below its five-day. Well, here I am saying that the trend is lower while the SPX hits new highs.
I think we all know the reason is that there are two markets. One market of stocks is harmed by COVID-19, and another market of stocks is helped by COVID-19. Most of the mega-cap stocks are COVID-19 beneficiaries and they are keeping these major indexes pointing higher.

This is a look at the number of new 52-week lows. Quoting Mike Burk, "nothing really bad ever happens in the stock market unless there is an elevated number of new 52-week lows." I believe this, but I also know that these new lows can pick up very quickly, so you need to look at this indicator every single day.
In my opinion, as long as the new lows are below the 50-level on both exchanges, our holdings are much safer. On the other hand, if one or both of the indexes exceed 50, then the warning flags are flying.

The Longer-Term Outlook
M2 growth has resumed, which helps the economy and helps stock prices, particularly the gold and silver miners.

The ECRI index has begun to accelerate slightly and now it gives the impression that it will pop up above the zero-level in the weeks ahead. I tend to think that when this index is above zero, it means that the economy is most likely expanding, even if it is just muddling along.

Outlook Summary
- The medium-term trend is uncertain.
- The short-term trend is down as of August 13.
- The economy is in recovery as of August 14.
- Contrarian Sentiment favor is uncertain.
- The medium-term trend for Treasury bonds is up as of January 25 (prices higher, yields lower).

Comments
Log in or sign up to join the conversation.