

Hello everyone. In today’s article, we will look at the past performance of the 1 Hour Elliott Wave chart of General Electric Co. ($GE) The rally from 6.23.2023 low unfolded as a 5 wave impulse with an incomplete bullish sequence from 7.19.2023 low. So, we advised members to buy the pullback in 7 swings at the blue box area ($112.75 – 109.95). We will explain the structure & forecast below:
$GE 1H Elliott Wave Chart 8.01.2023:
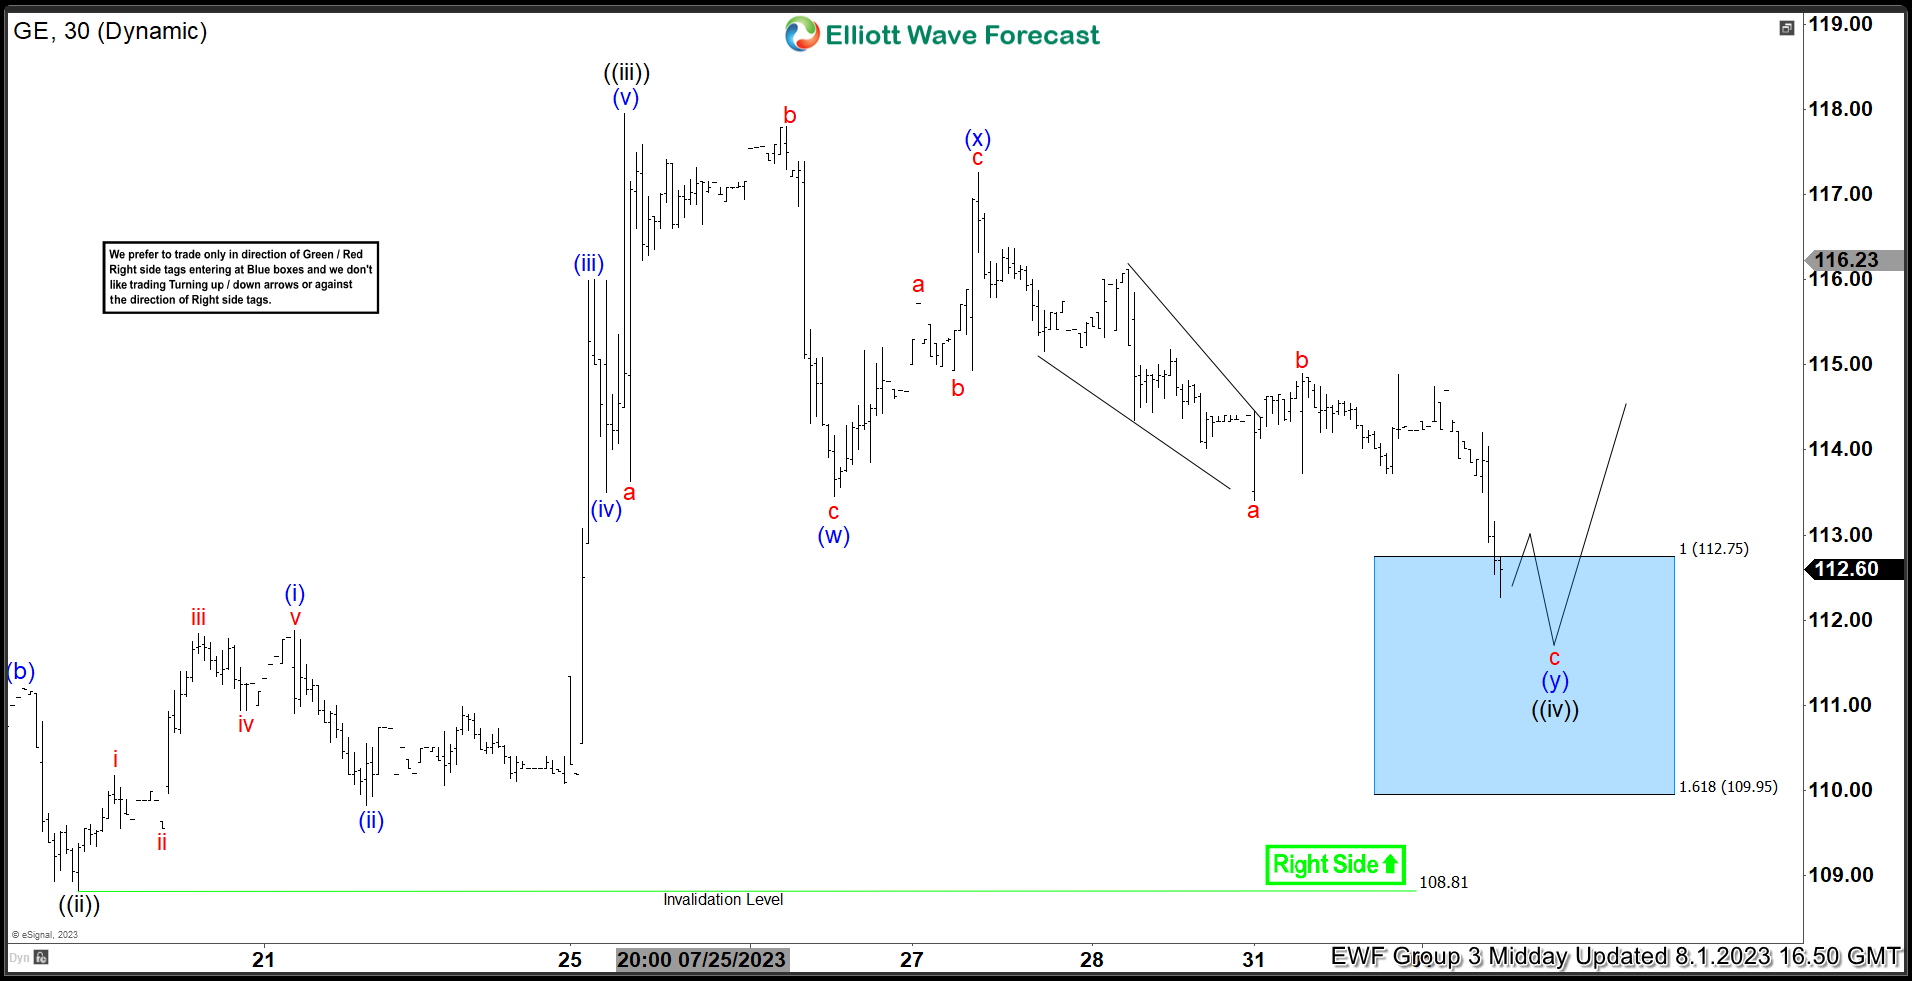 Here is the 1H Elliott Wave count from 8.01.2023. The rally from 7.19.2023 at black ((ii)) unfolded in a 5 wave impulse which signaled a bullish trend. We expected the pullback to find buyers in 7 swings at $112.75 – 109.95 where we entered as buyers.
$GE Latest 1H Elliott Wave Chart 8.08.2023:
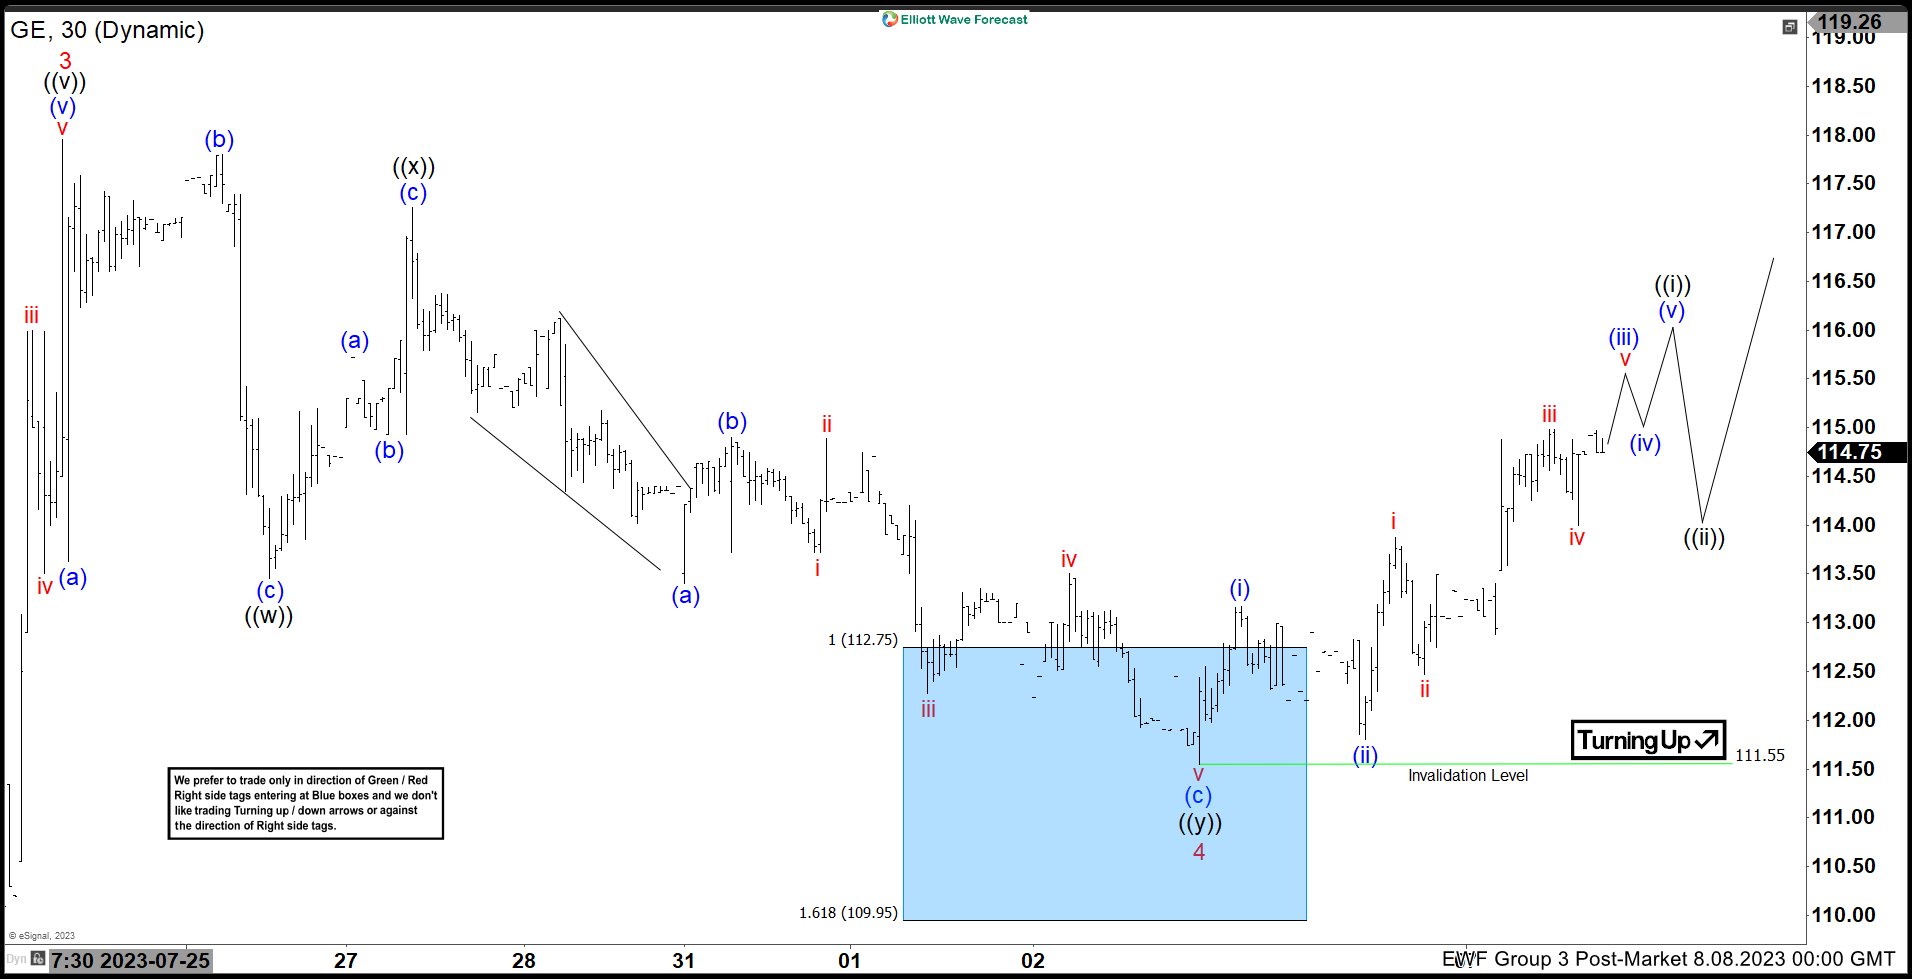 Here is the latest 1H update from 8.08.2023 showing the move taking place as expected. The stock has reacted higher from the blue box allowing longs to get a risk free position. The pullback can become 11 swings where we will like to buy it again should that happen. Near term, we like it higher towards a new high for the year towards $119 before another pullback can happen.
Source: https://elliottwave-forecast.com/stock-market/general-electric-co-ge-reacts-higher-blue-box-area/



Comments
Log in or sign up to join the conversation.