


GDP is only one measure of income.
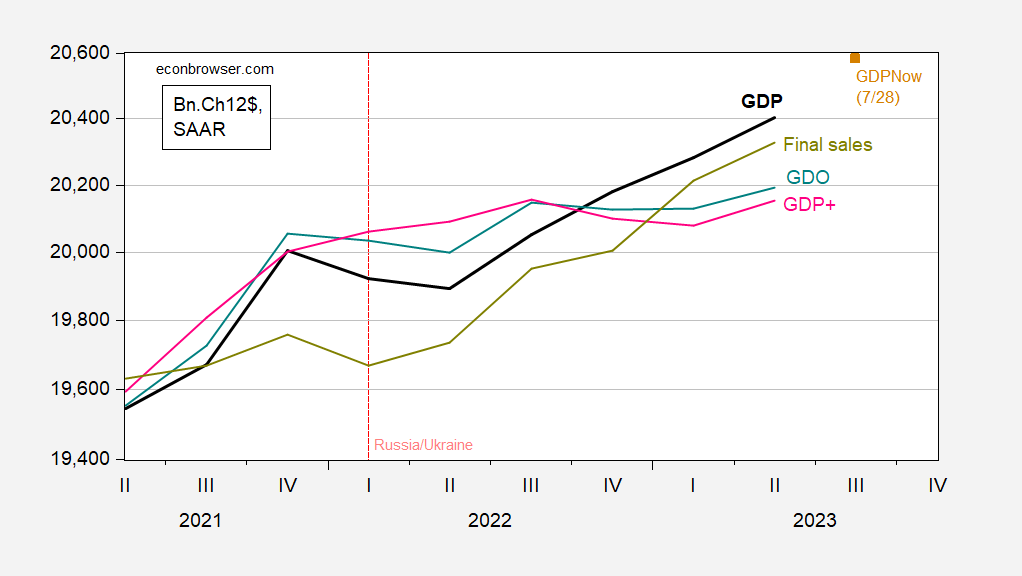
Fiugre 1: GDP (bold black), GDPNow as of 7/28 (tan square), GDO (teal), GDP+ (red), final sales (chartreuse), all in bn.Ch.2012$ SAAR. GDO assumes net operating surplus drops $100 bn SAAR in Q2. GDP+ level GDP+ growth rates iterated on 2019Q4 GDP. Source: BEA 2023Q2 advance, Atlanta Fed, Philadelphia Fed (7/28), and author’s calculations.
GDI is not available for 2023Q2, but all but one major component of GDI (net profit) is reported. Assuming net profit falls by $100 billion (SAAR) in Q2, I estimate Q2 GDO in Figure 1.
While 2022Q4-23Q1 saw GDO and GDP+ decline, both have increased in Q2, as have final sales.
More By This Author:
Business Cycle Indicators At July’s End
Still Chugging Along
CVO Projection Defers The Downturn


Comments
Log in or sign up to join the conversation.