

The October Wall Street Journal survey of economists, now quarterly, is out. A substantial downshift in the forecasted level of GDP is apparent.
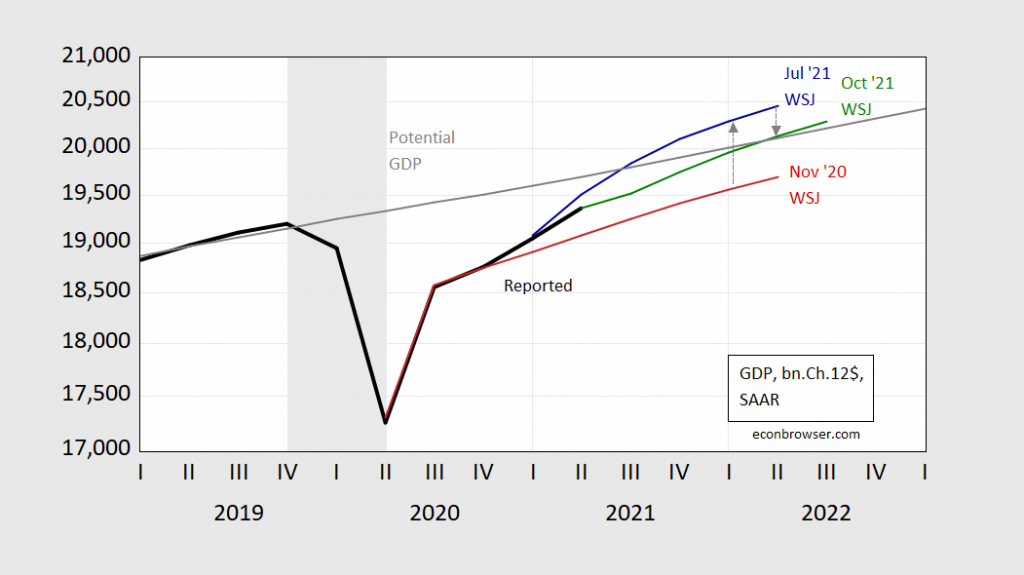
Figure 1: GDP (bold black), November 2020 WSJ survey mean (red), July 2021 survey mean (blue), and October 2021 survey mean (green). NBER defined recession dates shaded gray. Source: BEA, WSJ (various surveys), NBER, and author’s calculations.
In early November 2020, the average forecast was for a slow closing of the output gap (using potential GDP as estimated by the CBO in July of this year). By July, optimism had built, implying a zero output gap by mid-2021. As of the October survey, the closing of the output gap had been pushed back to mid-2022 (For an alternative view of the “output gap”, see this post).
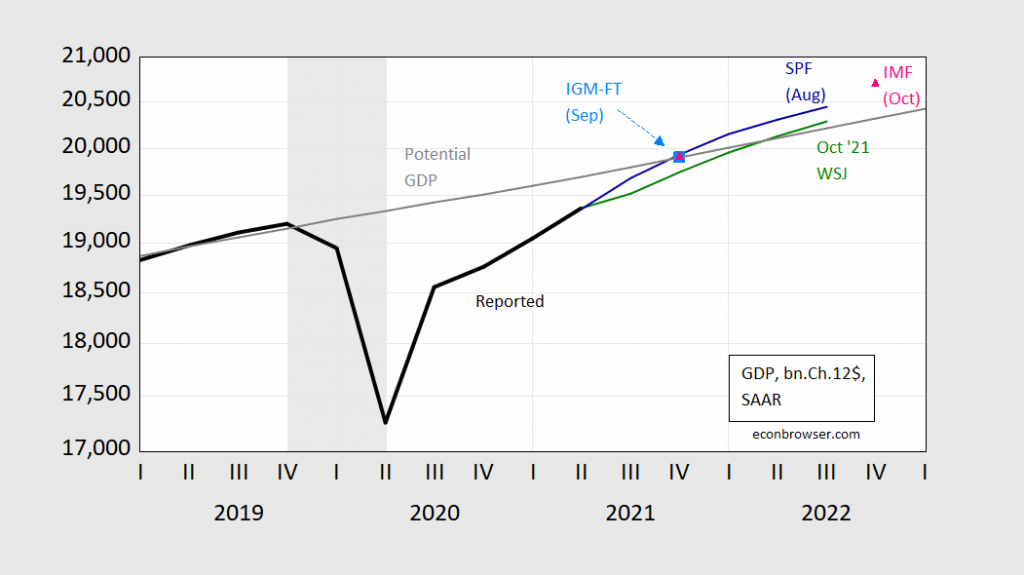
Figure 2: GDP (bold black), October 2021 WSJ survey mean (green), Survey of Professional Forecasters August survey mean (blue). FT-IGM September survey median (sky blue square), IMF World Economic Outlook October forecast (pink triangle). NBER defined recession dates shaded gray. Source: BEA, Philadelphia Fed, FT-IGM survey, IMF, WSJ (various surveys), NBER, and author’s calculations.
Certainly, the short term outlook does seem a bit lackluster, as indicated by monthly metrics (e.g., industrial production, in this post), and by GDP nowcasts (as of today, IHS-MarkIt is at 1.4% q/q SAAR for Q3).
The IMF remains noticeably more optimistic than the average WSJ survey respondent, looking more like the Survey of Professional Forecasters prediction.



Comments
Log in or sign up to join the conversation.