

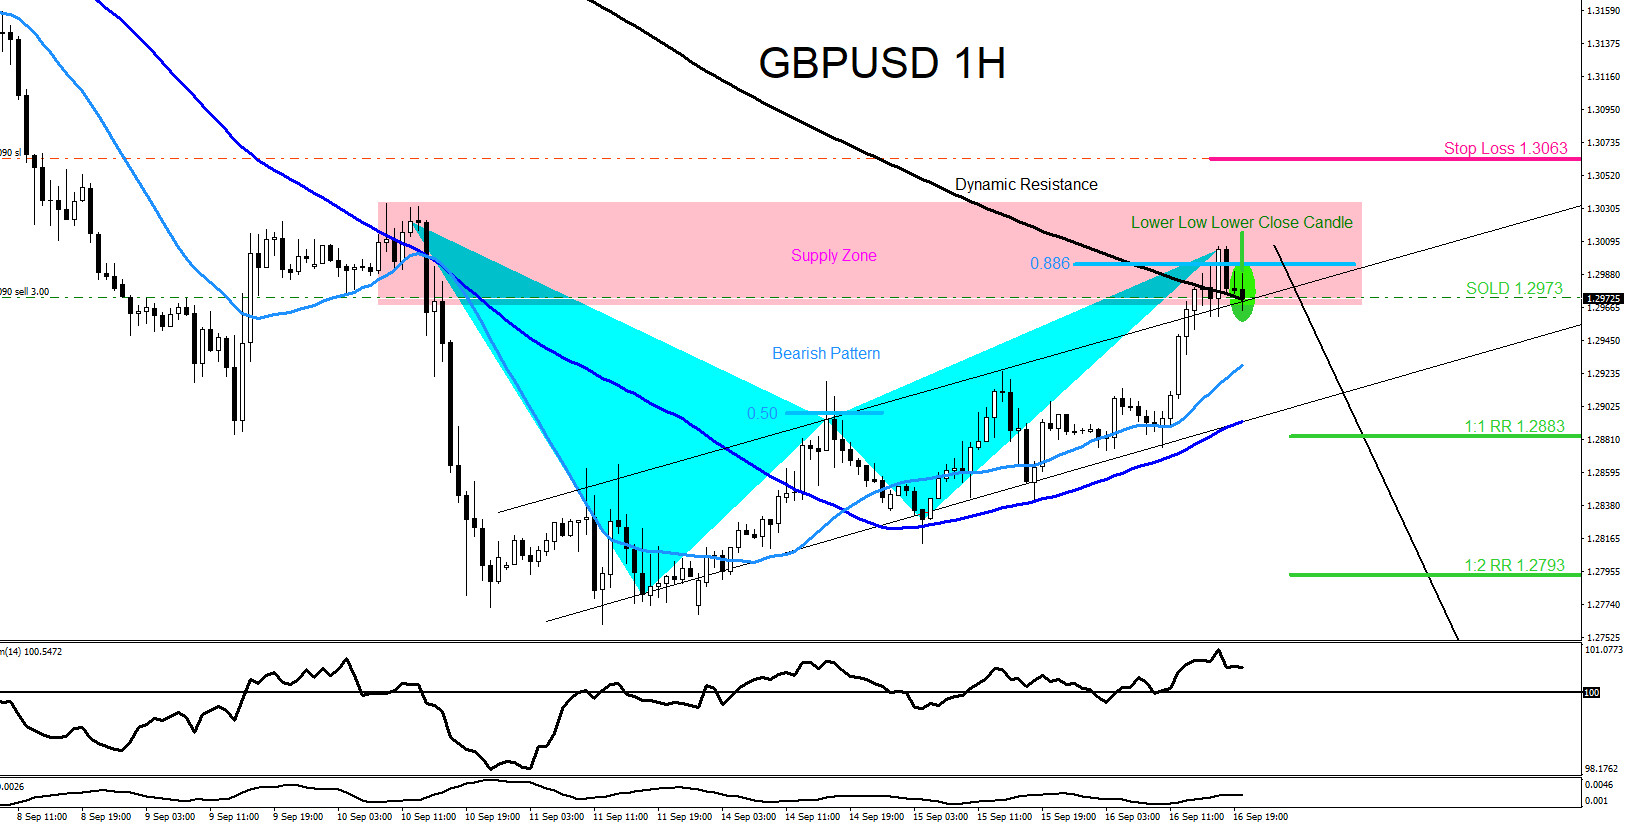
On September 16, I posted on social media: “GBPUSD - Watch for selling opportunities as long as the price stays below 1.3060.” The chart below of the GBPUSD pair was also posted on social media, showing that a bearish market pattern (light blue) formed and triggered sell signals at the 0.886% Fib. retracement level.
The bearish pattern (light blue) also triggered sell signals in a key resistance zone (pink), which was clearly visible and signaled to traders to only look for selling opportunities. I called for traders to sell GBPUSD and stated that only a move above the pink resistance zone would invalidate the sell trade setup. The stop loss was set above this zone, targeting the green 1:1 RR and 1:2 RR targets.
GBPUSD One-Hour Chart For September 16, 2020
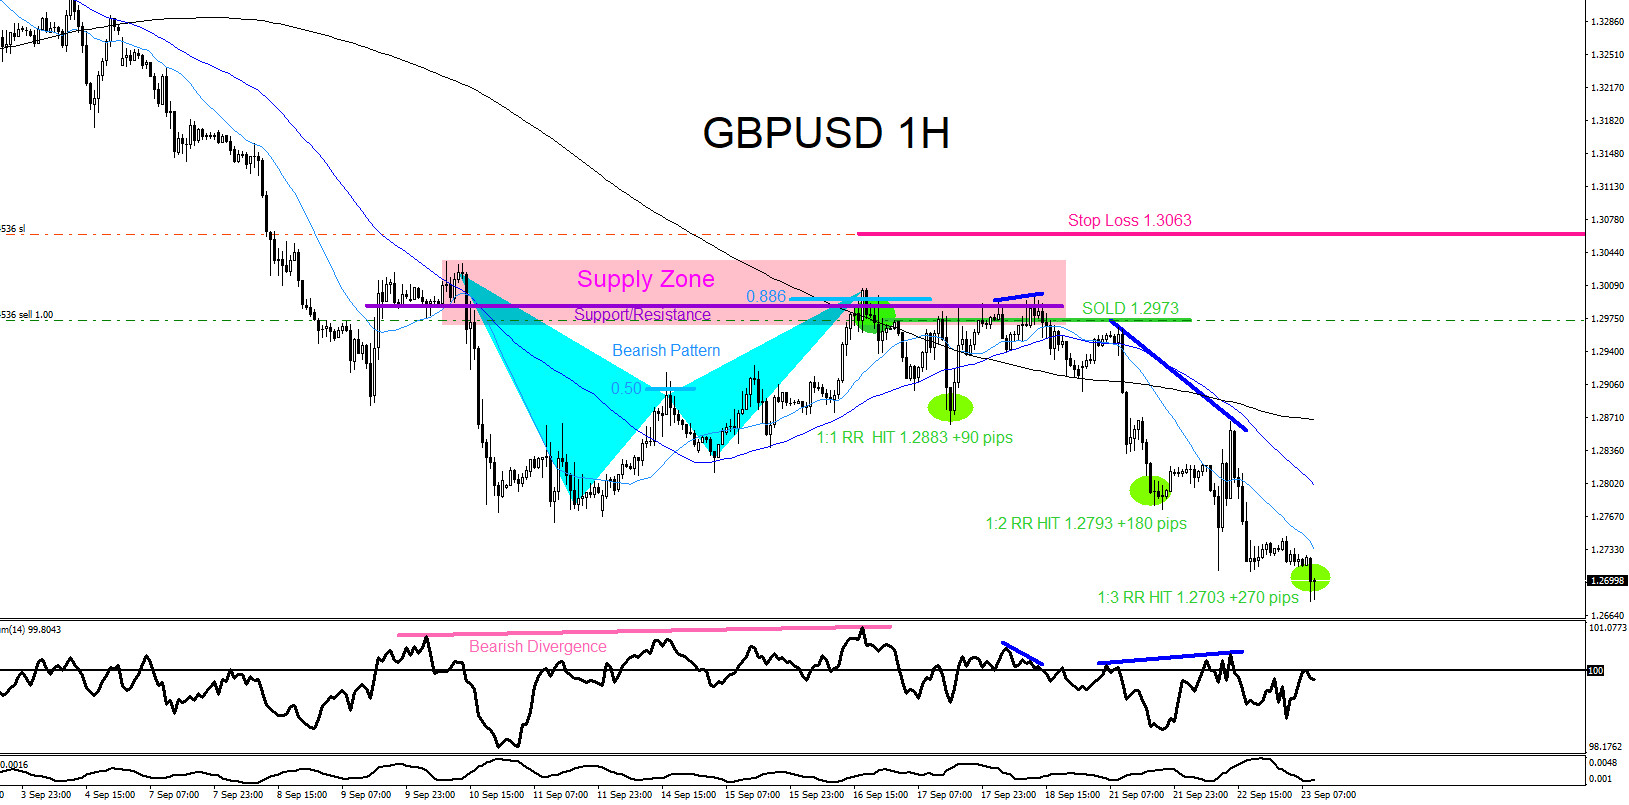
GBPUSD eventually moved lower and, on September 23, the price hit the 1:3 RR target at 1.2703 from 1.29973 for +270 pips. The chart below also displays bearish divergence patterns before the decline and during the move lower.
GBPUSD One-Hour Chart For September 23, 2020
Of course, like any strategy, there will be times when the chosen approach fails so proper money/risk management should always be used on every trade.



Comments
Log in or sign up to join the conversation.