

GBP/USD has spent recent months rewarding traders who were prepared to buy dips, but the market is beginning to look less comfortable with that familiar pattern.
The recent move lower does not yet prove that sterling’s broader strength is finished. However, the way the pair has responded to failed upside attempts suggests that confidence may be shifting.
What matters now is not simply whether GBP/USD has fallen, but whether the market can recover the levels it has just lost.
Why GBP/USD Is Worth Watching Now
At the end of last week, we saw Fed Chair Kevin Warsh make a more hawkish than expected speech at Jackson Hole. The market was surprised enough by his emphasis on inflation remaining too high to shift its expectation on the near-term path of rate hikes by the Federal Reserve. According to the CME FedWatch tool, the market is currently pricing in a 60% chance of a 0.25% rate hike at the September meeting, with conviction increasing in recent hours.
The bullish breakout was already failing when this major fundamental/sentimental positive for the USD arrived. When news breaks and pushes the direction in which the price is already turning, this can trigger very solid moves which might be worth trading.
GBP/USD Price Action Shows a Shift in Momentum
A few days ago, we had a bearish head and shoulders chart pattern complete, but it seemed to fail again. However, things then turned around last week after another failed attempt to make a fresh 6-month high, with a new bearish head and shoulders with doubled shoulders on each side forming with a neckline at $1.3618. This finally broke down decisively last Wednesday, and the round number below, at $1.3600, was also quickly broken and flipped to act as strong resistance, holding the price over two days.
After two days had passed, on Friday with the next pro-short trade input (Warsh’s Jackson Hole speech), the market got enough conviction for another meaningful downwards price movement off 1.3600, breaking below former key support at 1.3552 which has now seemingly cleanly flipped to become strong resistance, which is a further bearish sign.
The problem for bears now is that the price has found support in a formerly inflective area at about 1.3525, and there are signs of further support at points running lower from there until the big round number at 1.3500. However, if we get another strong rejection of the resistance level at 1.3552, it might be traded lower if risk to reward looks appropriate at the entry, until at least 1.3525.
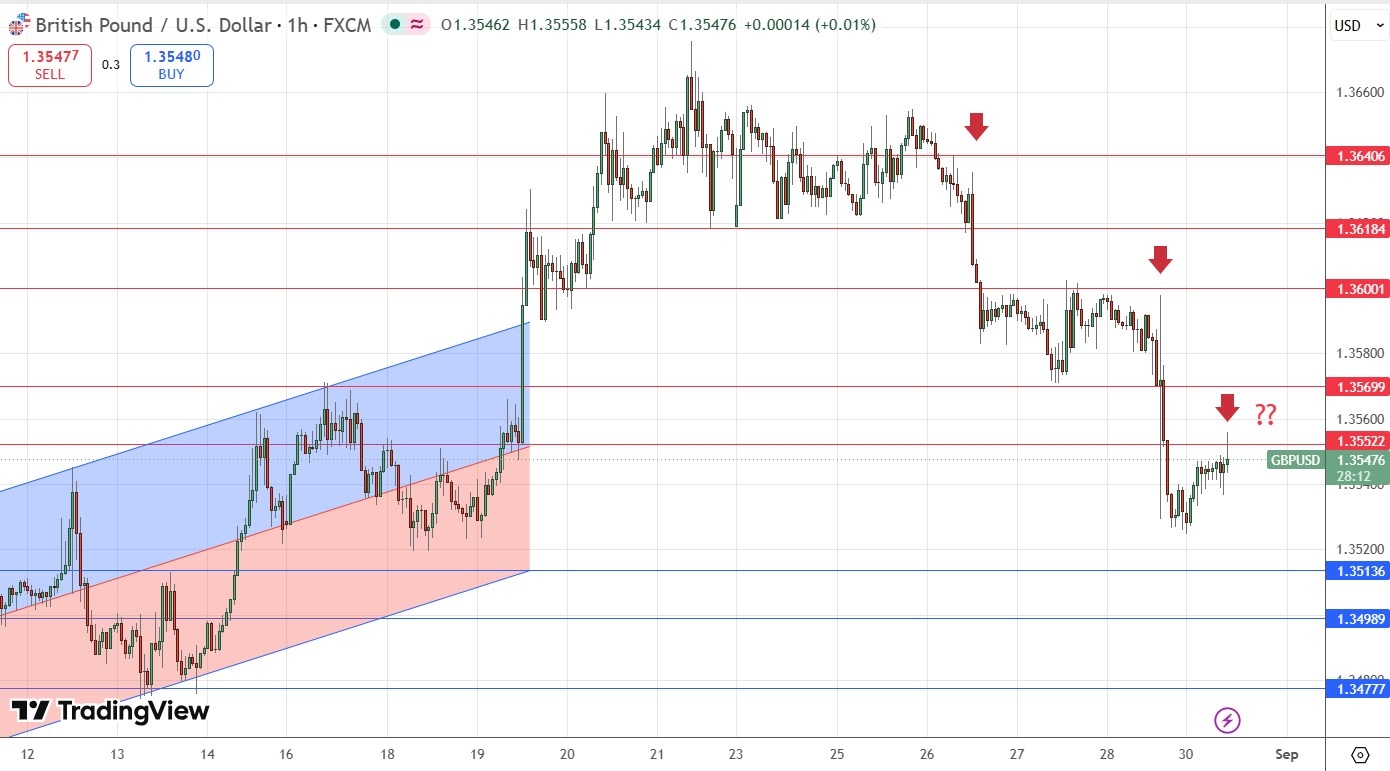
GBP/USD H1 Price Chart Showing Shoulders
The Blind Spot: Why the Short Case May Not Be Straightforward
The blind spot here may be how quickly this bearish setup has become obvious. The head-and-shoulders breakdown, the rejection from 1.3600, and the more hawkish US Dollar backdrop all make the short case easy to understand. That is exactly why traders should be careful about assuming the next move lower will be clean or immediate.
GBP/USD has already fallen into an area where buyers have shown interest, while 1.3500 is an obvious big round number below. Markets often become difficult when a technically attractive trade gains broad agreement just as it approaches nearby support. There is also a longer-term bullish backdrop which has not disappeared merely because the recent breakout failed.
The bigger risk for bears may not be that the analysis is wrong, but that they enter too late and with too little room for error. If price cannot establish itself below 1.3500, short-term profit-taking and renewed sterling demand could produce a sharp recovery. That would not automatically invalidate the bearish structure, but it would make timing much more important.
What Could Still Support Sterling
Although technical and sentimental factors suggest the next major price movement will be lower, how might an alternative bullish scenario play out? There is a long-term bullish trend here, even though it is not very strong, but it has persisted over many months and could still provide a residual which will see prices moving higher again. Although the current bearish move looks very serious, what if this is just a deep bearish retracement? After all, it does not feel likely to clear 1.3500 today.
I see the most likely bullish scenario as being a move lower to the 1.3500 area which then produces a strong bullish bounce, sucking in longs who push the price upwards to make a new 6-month high price, or at least back above the level at 1.3552 which looks like it has potential to be today’s pivotal point.
GBP/USD is worth watching because it has failed to break to a new long-term high, is showing bearish price action, and has a long way to fall while remaining within its dominant range, suggesting there could be a good opportunity to get involved on the short side, although that moment might well not be arriving today. Alternatively, the pair may surprise, if the long-term bullish trend reasserts itself and produces a fresh high this week.

Comments
Log in or sign up to join the conversation.