


Crypto has enjoyed a comeback in recent weeks, with Bitcoin finally making a significant bullish breakout to new multi-month highs, and for a while it looked like we might see it really take off to the upside. However, momentum has faltered, but when we look more closely, we can see that the price is coiling tightly below a key resistance level, indicating another, potentially stronger, bullish breakout could be on the cards.
The daily chart shows a continuing consolidation below a key resistance level at $87,293. Since the price made its earlier technically significant bullish breakout above the round number at $80,000 on 21st September, it has been consolidating tightly and neutrally, in what looks to be a textbook bullish breakout accumulating preparation. This kind of chart pattern can end in an explosive bullish breakout once the sellers defending $87,293 capitulate. Of course, this level might hold, but I sense from my experience combined with looking at the chart that they likely will not. A bullish breakout will be into multi-month blue sky and could travel quite a way.
A bullish breakout could also get a tailwind from rising stock markets, when have some positive correlation within a rising Bitcoin and cryptocurrency sector, and from a potentially weaker US Dollar as expectations lower of future Fed rate hikes – although so far, despite a more dovish outlook on the Fed, the US Dollar has been continuing upwards to new highs. It could be this last factor which is preventing a breakout above $87,293 from happening so far.
Drilling down to shorter time frames, we see some bullish indications in the form of new higher support levels being printed by developing price action at $85,468 and $84,241.
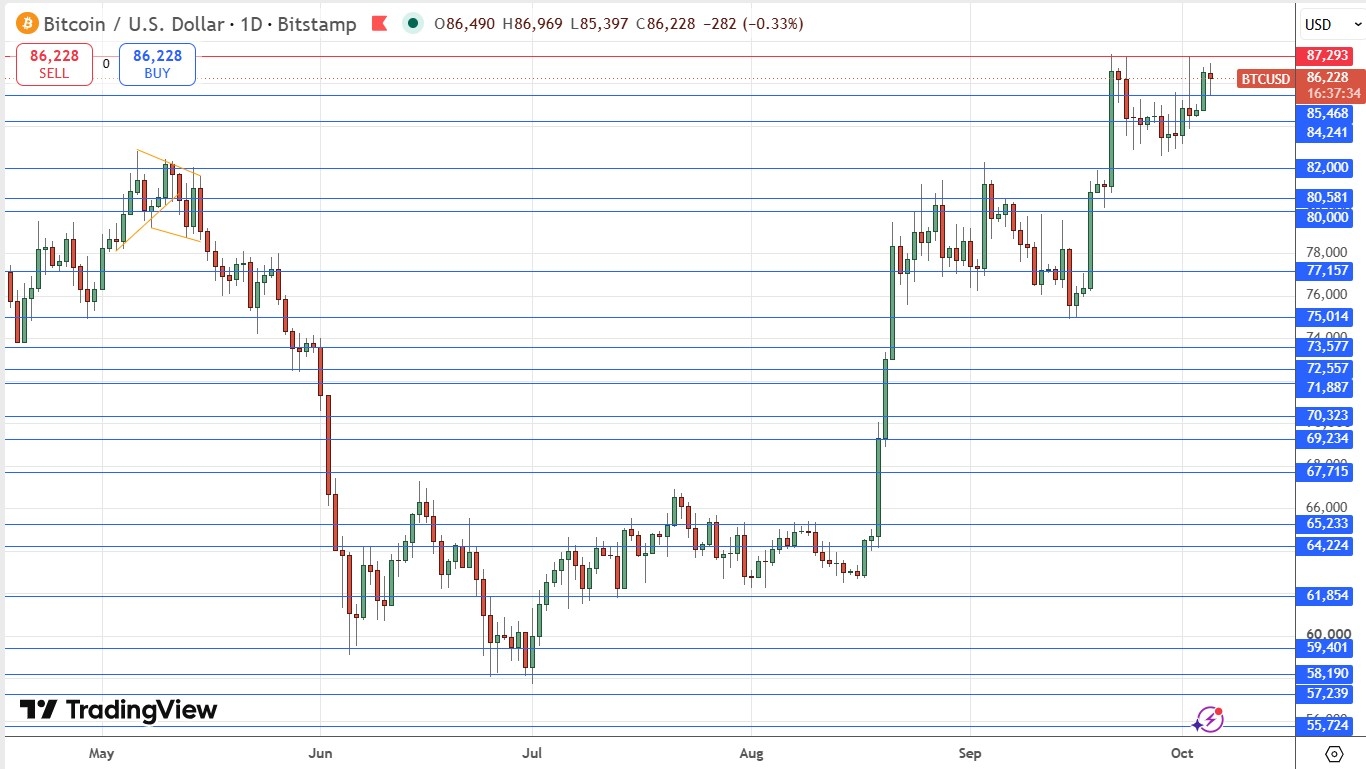
Bitcoin Price Chart
My Take on BTC/USD
I am already long of Bitcoin as a trend trader, and I use a volatility-based trailing stop, but I think a daily close below $80,000 would be a good signal for anyone to get out of a long position if they are only in it for the relatively short term.
I think a daily close above $87,293, especially if near the top of the day’s range within an unusually large daily candlestick, will be an exiting signal to either enter a new long trade, or add to a long position if already long.
I am not interested in taking a short trade in Bitcoin today.
Review, Support & Resistance Levels
Today’s BTC/USD Signals
Risk 0.50% per trade.
Trades may only be entered by 5pm Tokyo time Tuesday.
Long Trade Ideas
Go long after a bullish price action reversal on the H1 timeframe following the next touch of $85,468, $84,241, or $82,000.
Place the stop loss $100 below the local swing low.
Move the stop loss to break even once the trade is $100 in profit by price.
Take off 50% of the position as profit when the trade is $100 in profit by price and leave the remainder of the position to ride.
Short Trade Idea
Go short after a bullish price action reversal on the H1 timeframe following the next touch of $87,293.
Place the stop loss $100 above the local swing high.
Adjust the stop loss to break even once the trade is $100 in profit by price.
Take off 50% of the position as profit when the trade is $100 in profit by price and leave the remainder of the position to ride.
The best method to identify a classic “price action reversal” is for an hourly candle to close, such as a pin bar, a doji, an outside or even just an engulfing candle with a higher close. You can exploit these levels or zones by watching the price action that occurs at the given levels.
There is nothing of high importance scheduled today concerning Bitcoin or the US Dollar.

Comments
Log in or sign up to join the conversation.