


Forex currency pairs typically don’t do very much, being one of the least volatile asset classes. However, there are moments where price charts do show important and obvious technical developments, and there are times where political developments produce fundamental or sentimental factors which can move currencies. Sometimes, both happen together. Yesterday was such a day for the British Pound, especially here in its pairing against the US Dollar.
Most analysts think that this was a one-off and not a trend change, but traders might still be able to exploit it in the GBP/USD.
New UK Government May Usher in Change
Yesterday was a politically historic day in the UK, as former Prime Minister Keir Starmer formally left the role while Andy Burnham was appointed by the ruling Labour Party. Despite winning an election barely two years ago, his government became wildly unpopular, leading to his replacement by Burnham, who will be shuffling ministers and appointing a new finance minister. There can be little doubt that the new government will be under pressure from its supporters to take more radical action to move the UK in a more left-wing direction, because if the Labour Party does not deliver any change it can claim as improvement, it will have no chance of winning the next election. This has led markets to show some concern about how the new government will handle fiscal matters, and we saw markets yesterday see the Pound as a little more risky now.
When a new government takes office, a new mood or new trend can start in its currency for fundamental reasons. This might be starting to happen in the UK now, which is why it is worth paying attention to this currency pair and what it is doing technically.
GBP/USD Price Action
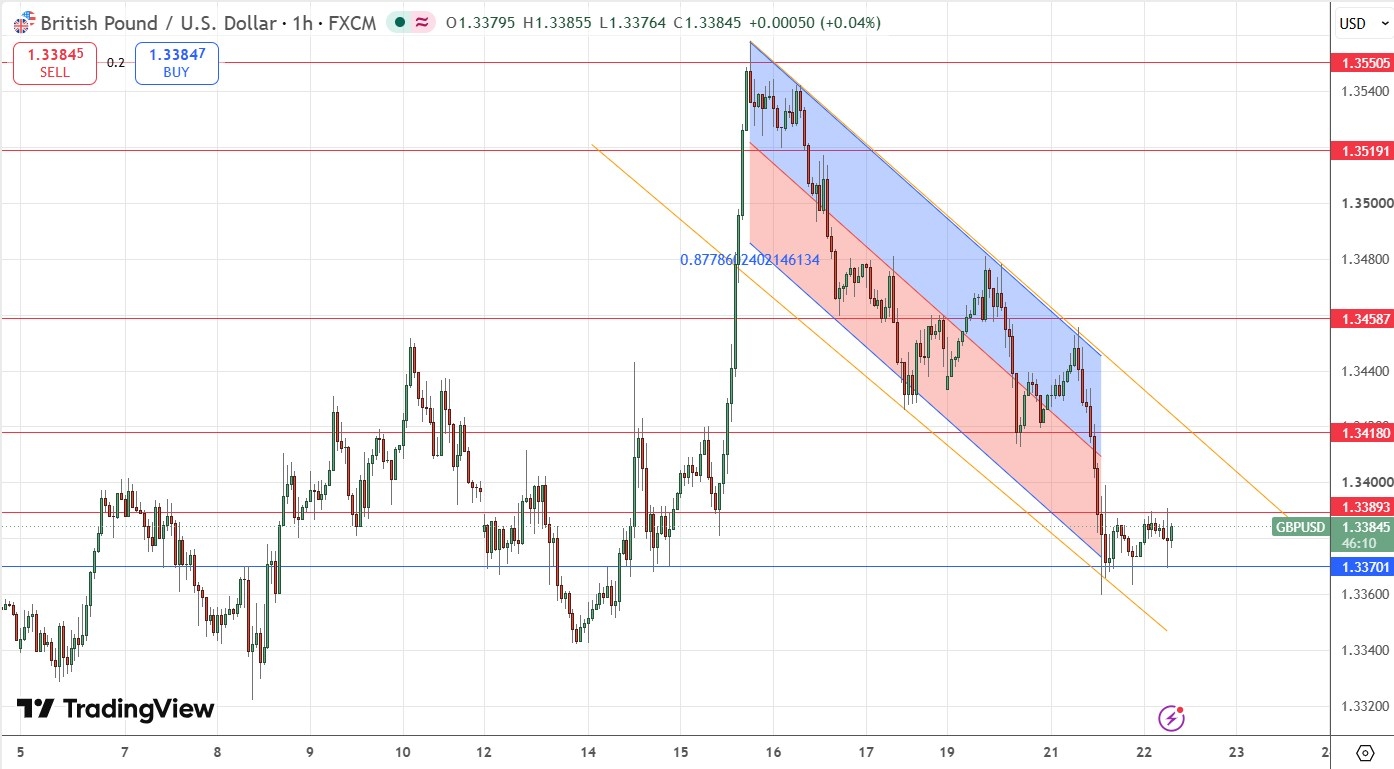
Yesterday saw a rejection of the descending trend line which forms the upper boundary of the descending rice channel which is still containing the price action. The bearish rejection was especially powerful because the high was just short of the key resistance level at 41.3459 which was quite confluent with the descending trend line. The price then made a strong and tradable downwards move over the rest of the day, given a tailwind by the speculation in the news about the new fiscal appointments of the incoming prime minister.
Another noteworthy technical element is how all the support and resistance lines which were reached were either broken very cleanly or strongly respected. This, coupled with the symmetry of the descending price channel, shows technicals are important and being respected right now – this is why the price action remains within the channel.
The major downwards move occurred during the London session yesterday. Since yesterday’s New York open, we have seen the price contained between the support level at $1.3370 and the former support which has become resistance at $1.3389. This is quite a narrow range, and I see it as a short-term bearish consolidation.
GBP/USD Price Chart
My Take on the GBP/USD
I see the best opportunity here as likely to be on the short side side following a bullish breakout upwards out of the narrow consolidation, which will then generate a test of the confluence of the descending trend line and the horizontal resistance level at $1.3418. If the failure is firm, this could be a good signal to enter another short trade.
The alternative scenarios are that either the price breaks above $1.3418, which would be a bullish trend line break today, or that the price breaks below the currently firm support level at $1.3370 first, which could be bearish but would be unpredictable as there are historic bullish inflection points down there. I will not be taking any trades is either of those latter two scenarios play out today.
Support & Resistance Levels
Risk 0.75%.
Trades may only be entered prior to 5pm London time today.
Long Trade Ideas
Long entry following a bullish price action reversal on the H1 timeframe immediately upon the next touch of $1.3370, $1.3297, or $1.3264.
Put the stop loss 1 pip below the local swing low.
Adjust the stop loss to break even once the trade is 25 pips in profit.
Take off 50% of the position as profit when the price reaches 25 pips in profit and leave the remainder of the position to run.
Short Trade Ideas
Short entry following a bearish price action reversal on the H1 timeframe immediately upon the next touch of $1.3389, $1.3418, or $1.3459.
Put the stop loss 1 pip above the local swing high.
Adjust the stop loss to break even once the trade is 25 pips in profit.
Take off 50% of the position as profit when the price reaches 25 pips in profit and leave the remainder of the position to ride.
The best method to identify a classic “price action reversal” is for an hourly candle to close, such as a pin bar, a doji, an outside or even just an engulfing candle with a higher close. You can exploit these levels or zones by watching the price action that occurs at the given levels.

Comments
Log in or sign up to join the conversation.