


The GBP/USD pair trades in positive territory around 1.3490 during the early European trading hours on Thursday, bolstered by a weaker US Dollar (USD). Traders await the Bank of England (BoE) Governor Andrew Bailey’s speech and US August jobs data later on Friday for fresh impetus.
Federal Reserve (Fed) Chair Kevin Warsh delivered unexpectedly hawkish remarks at the Jackson Hole meeting last week, boosting market expectations for a rate hike next month. Warsh pledged to return inflation to the 2% target and indicated rates could rise further.
“The emphasis on inflation risks, together with Warsh’s explicit commitment to achieving price stability and his reluctance to pre-commit to future policy actions, reinforces the elevated risks of policy tightening this year, although it could also be the case of talking without action, said UOB analysts.
On the UK’s front, BoE policymaker Catherine Mann said that the UK economy had shown signs of stronger growth since the last monetary policy meeting. Mann added that the labour market had stabilised and inflation had been a little stronger than expected.
Financial markets on Tuesday were fully pricing a BoE rate hike by the end of the year but only around 15% odds of a rate increase at the September policy meeting, according to Reuters.
Pound sentiment steady as UK politics offer few fresh cues
Strategists at Scotiabank note that the domestic political backdrop remains quiet, with “political developments… equally limited, offering little to market participants in search of domestic drivers.” They “continue to highlight the importance of sentiment – specifically, politically-related sentiment – in driving the recent strength in the Pound following the arrival of PM Burnham in late June,” even as the current lack of new policy signals leaves investors with fewer fresh catalysts to trade on.
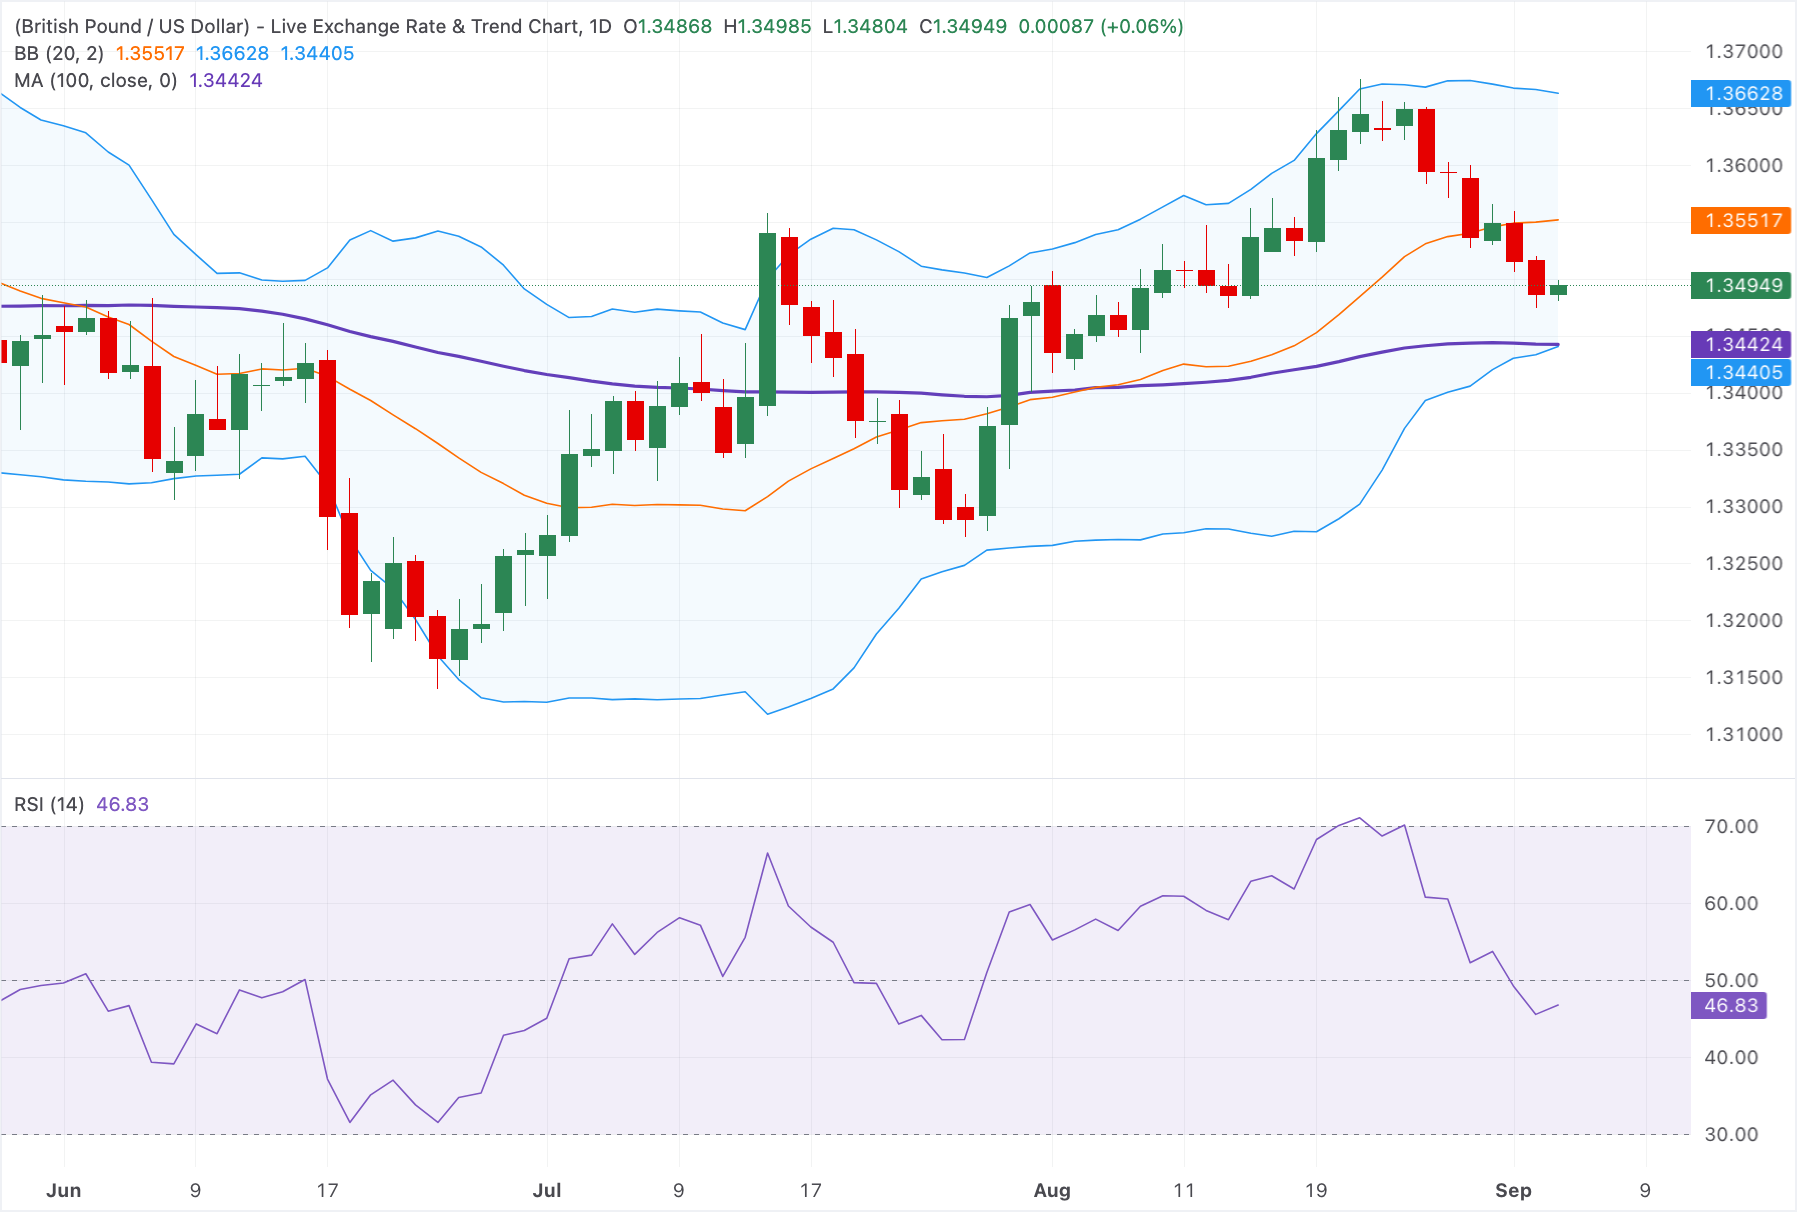
Technical Analysis: GBP/USD retains a mildly bullish tone above the 100-day SMA
In the daily chart, GBP/USD maintains a mildly bullish near-term bias as it holds above the 100-day Simple Moving Average (SMA) and the lower Bollinger band, suggesting underlying demand on dips. However, price remains capped beneath the Bollinger middle band, while the latest 14-day Relative Strength Index at 46.8 points to subdued momentum rather than a strong trending move.
On the topside, initial resistance is located at the Bollinger middle band at 1.3550. A stronger barrier is seen at the May 8 high of 1.3637, en route to the upper Bollinger band near 1.3665.
On the downside, the key support level to watch emerges at the 100-day SMA and the lower Bollinger band of 1.3440, forming a tight demand zone that would need to give way to signal a deeper corrective phase. A decisive break below this level could expose the July 13 low of 1.3342.



Comments
Log in or sign up to join the conversation.