


In this technical article, we’ll take a look at the GBPUSD Elliott Wave charts. GBPUSD has completed a textbook 5-wave pattern within a cycle that started at the 1.3677 peak. In this article, we’ll break down the Elliott Wave structure and examine the near-term outlook for GBPUSD.
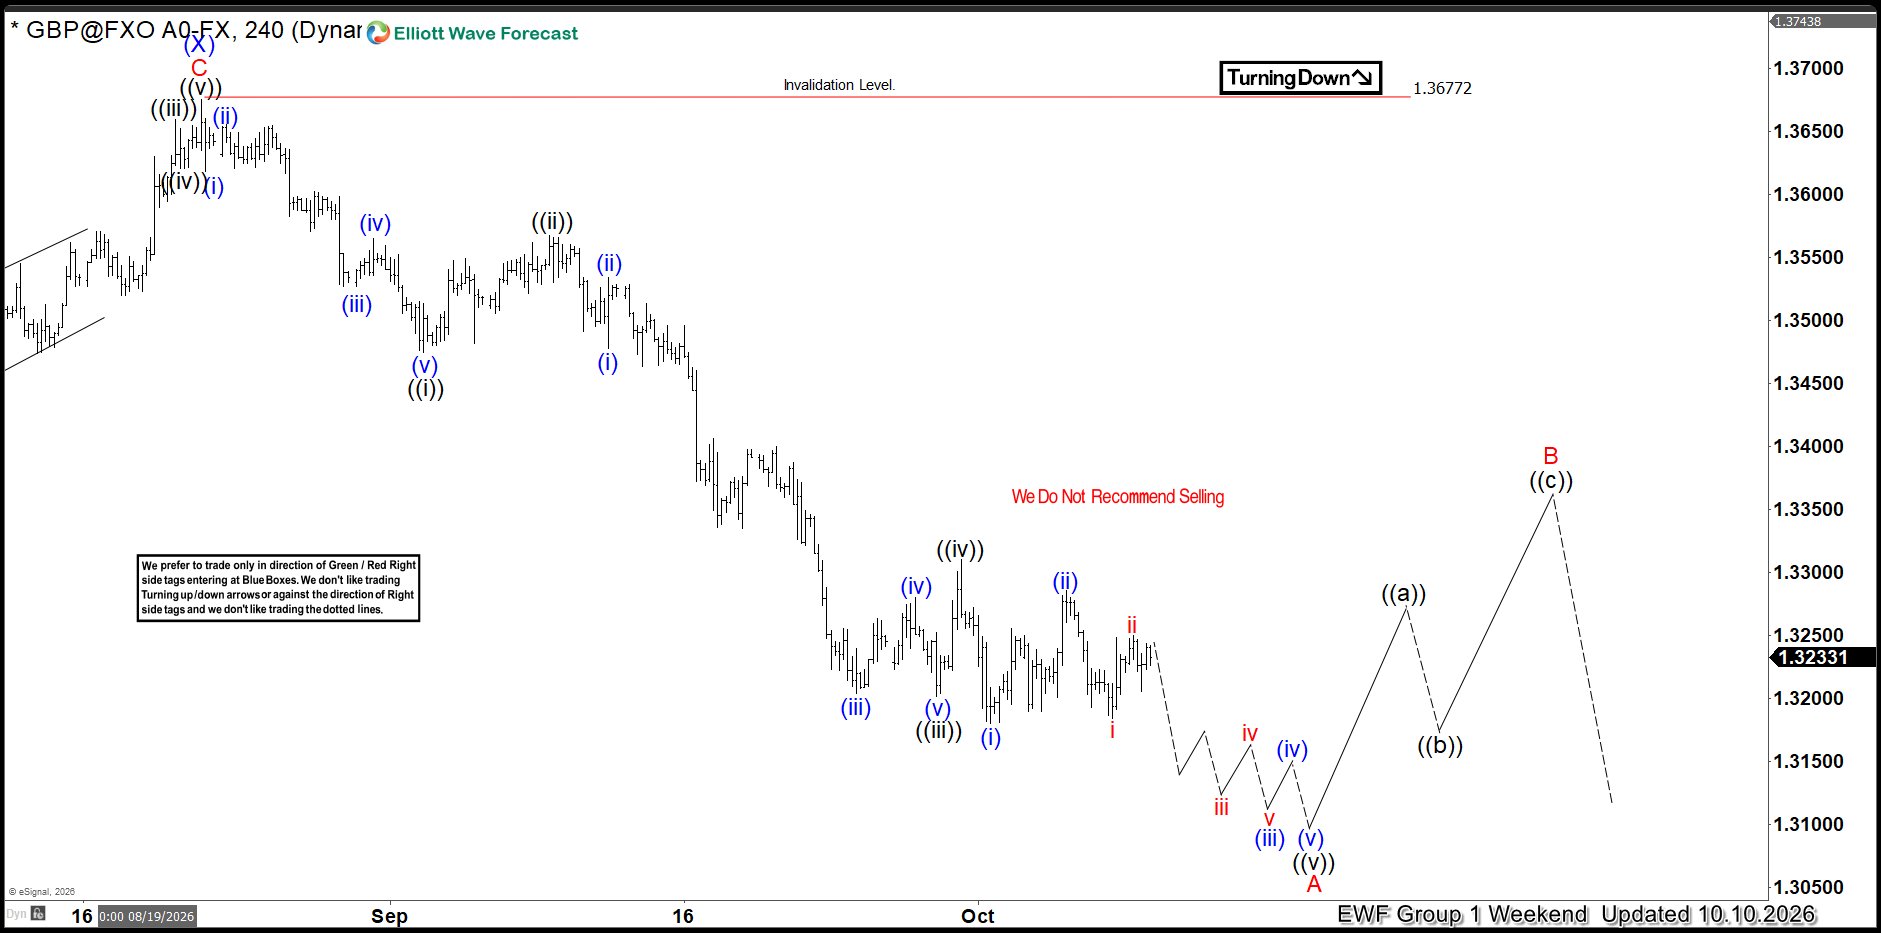
GBPUSD Elliott Wave 4 Hour Chart 10.10.2026
GBPUSD is forming a 5-wave pattern in the cycle from the 1.3677 peak. The current structure suggests an Elliott Wave Double Three pattern, with one more move down needed to complete the 5 waves. At this stage, we see ((iv)) as completed. However, we are aware that the structure could remain sideways and alternatively still develop into a Triangle pattern or even form an Expanded Flat before breaking toward new lows. Anyway, the target for wave ((v)) is obtained by measuring the inverse 123.6%–161.8% extension of wave ((iv)). In this case, the target for wave ((v)) comes in at the 1.3180–1.3140 area.
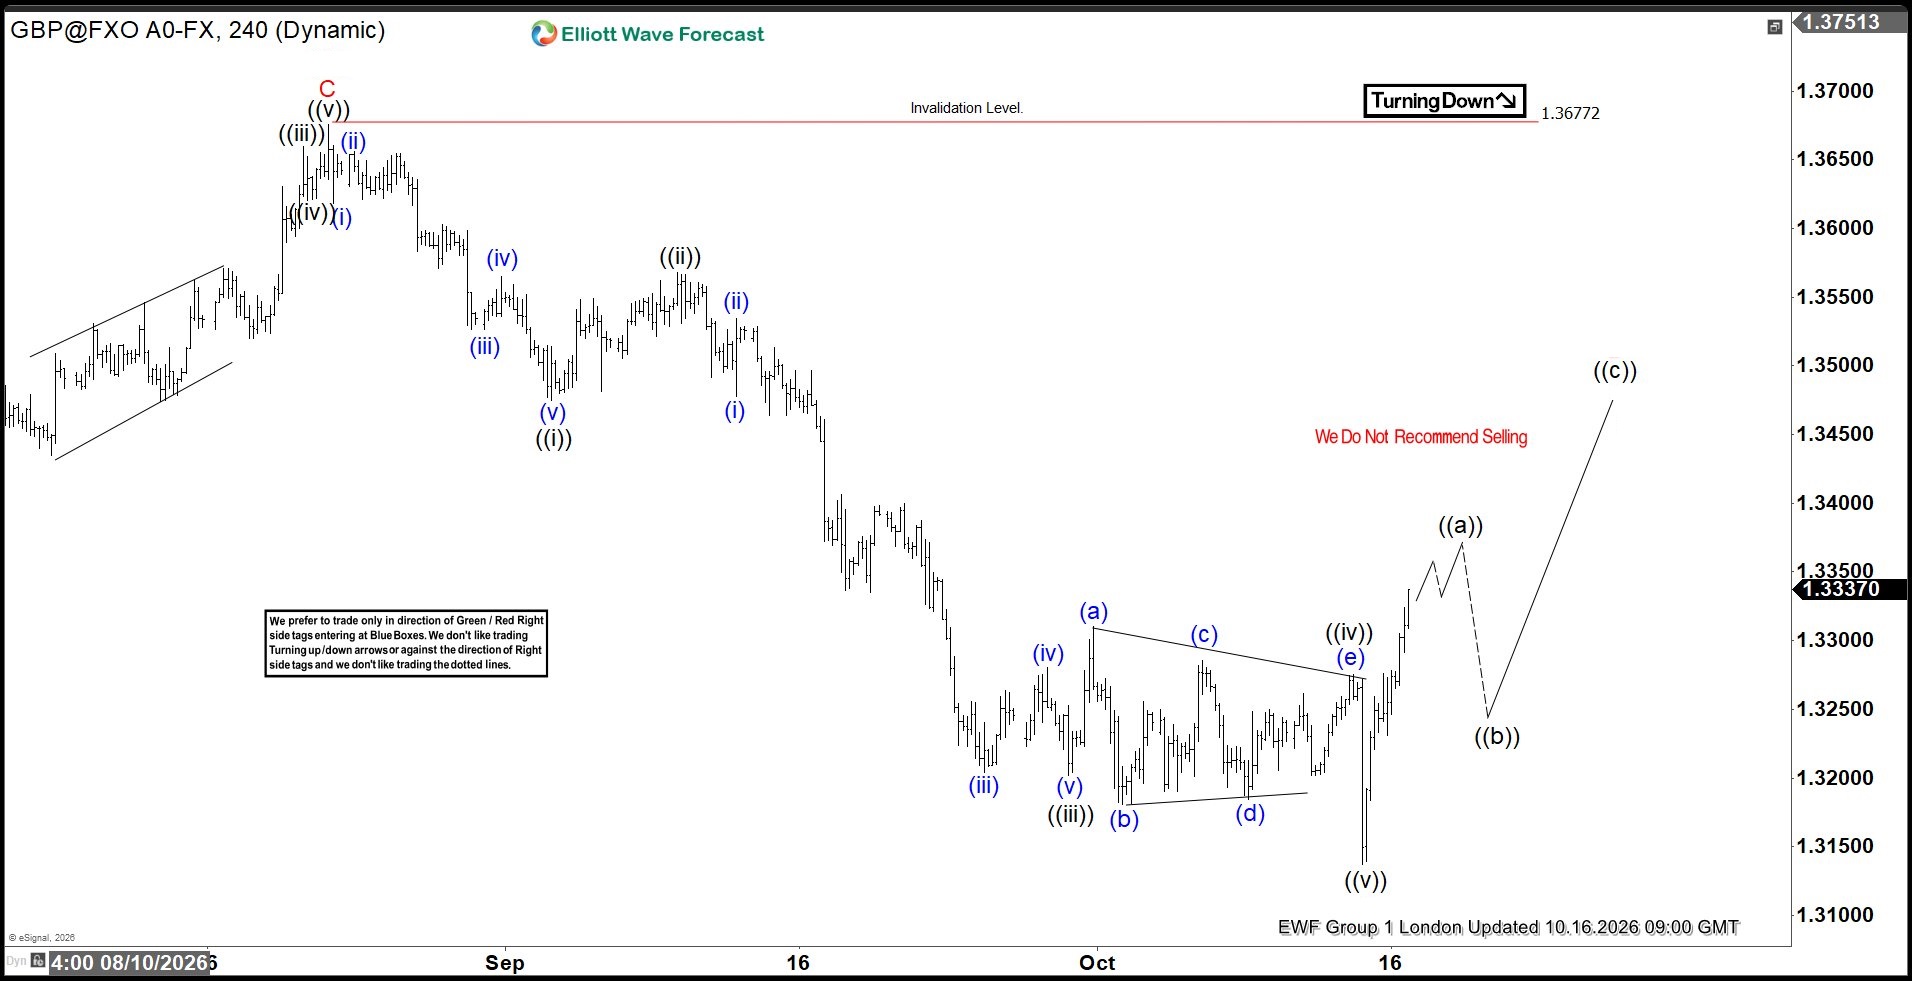
GBPUSD Elliott Wave 4 Hour Chart 10.16.2026
GBPUSD remained sideways and made another leg down after completing a Triangle pattern in wave ((iv)). Wave ((v)) reached our target zone and triggered a sharp rally that looks impulsive. The current view suggests that the rally could be the first leg of a larger bounce.



Comments
Log in or sign up to join the conversation.