


In this article, we’ll look at the price action of the GBPCAD and the potential near-term outlook. As our members know, the pair completed a three-wave pullback into the Equal Legs area. Buyers stepped in and triggered a decent rally.
Let’s examine the Elliott Wave structure and the key levels to watch for the next move in GBPCAD.
GBPCAD Elliott Wave 1 Hour Chart 10.14.2026
GBPCAD had been forming a three-wave correction. The price structure suggested that the pullback was incomplete, with another leg down expected to complete the pattern. As our members know, we use the Equal Legs zone to identify the buyers’ area where a correction will complete. We calculate this zone using the Fibonacci Extension tool, projecting the 1.0–1.236 extension of wave W red relative to wave X red.
In this case, our Elliott Wave analysis identified a buyers’ zone around 1.8766–1.8685. We recommended that our members avoid selling, while favoring the long side from the mentioned Equal Legs area.
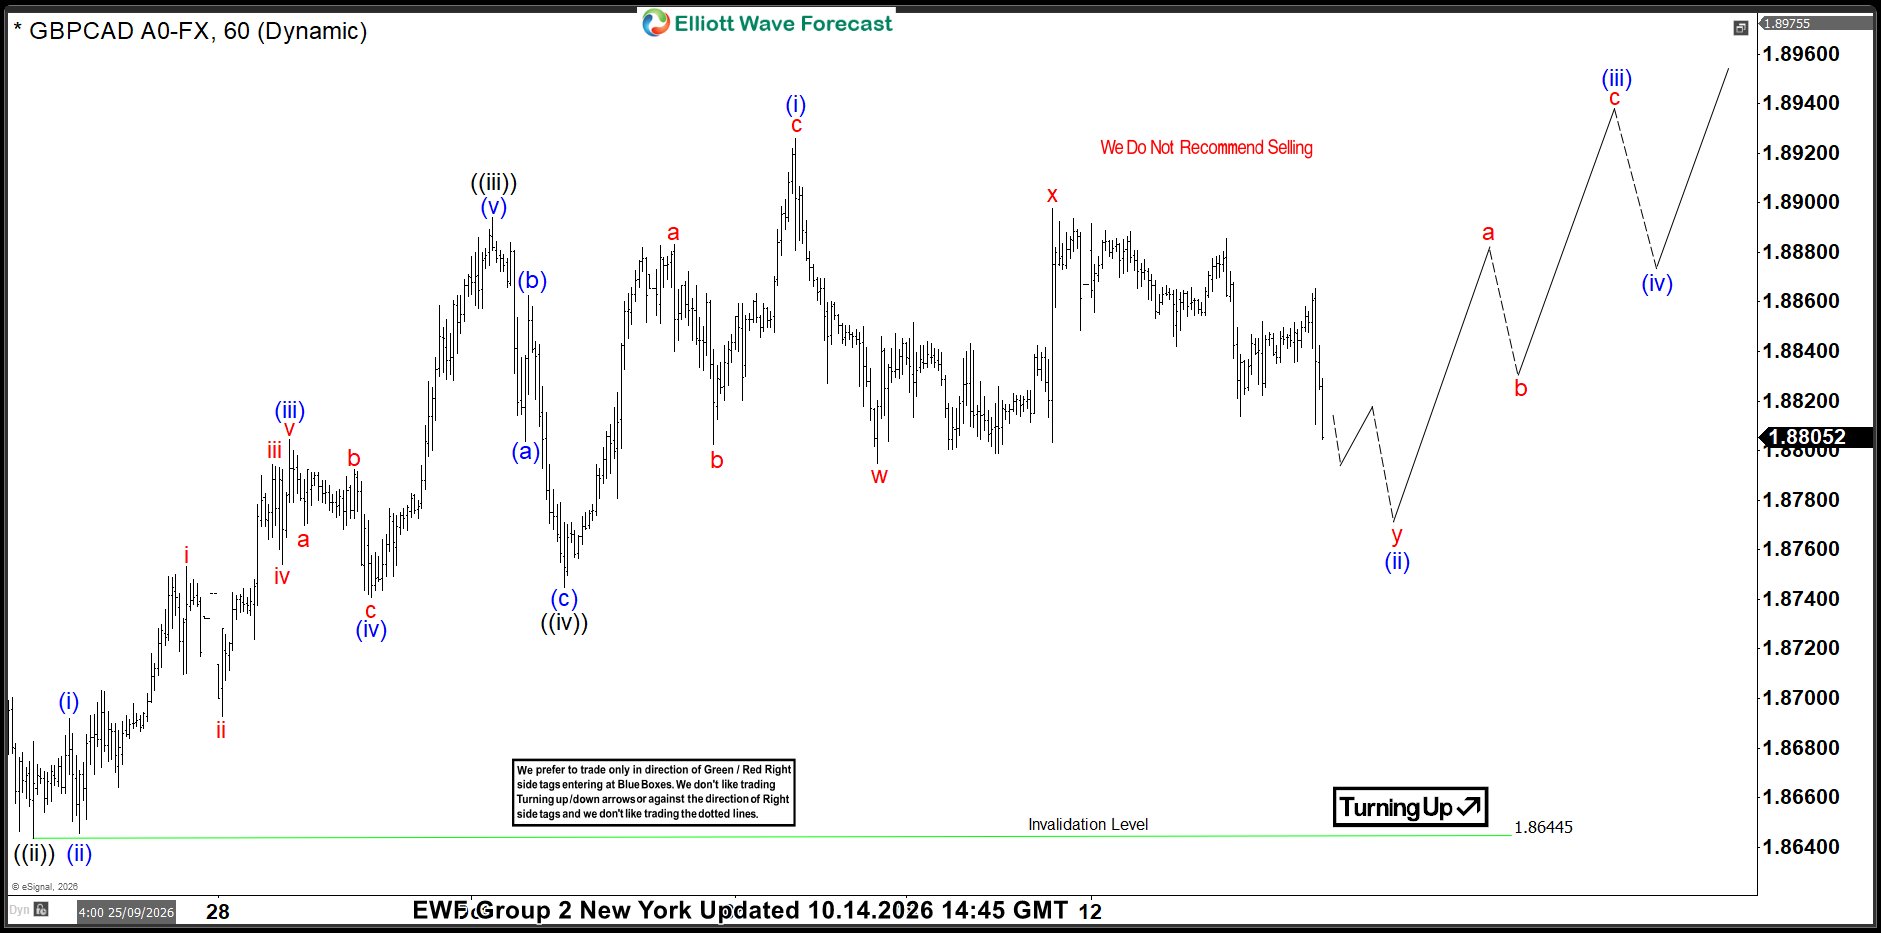
GBPCAD Elliott Wave 1 Hour Chart 10.14.2026
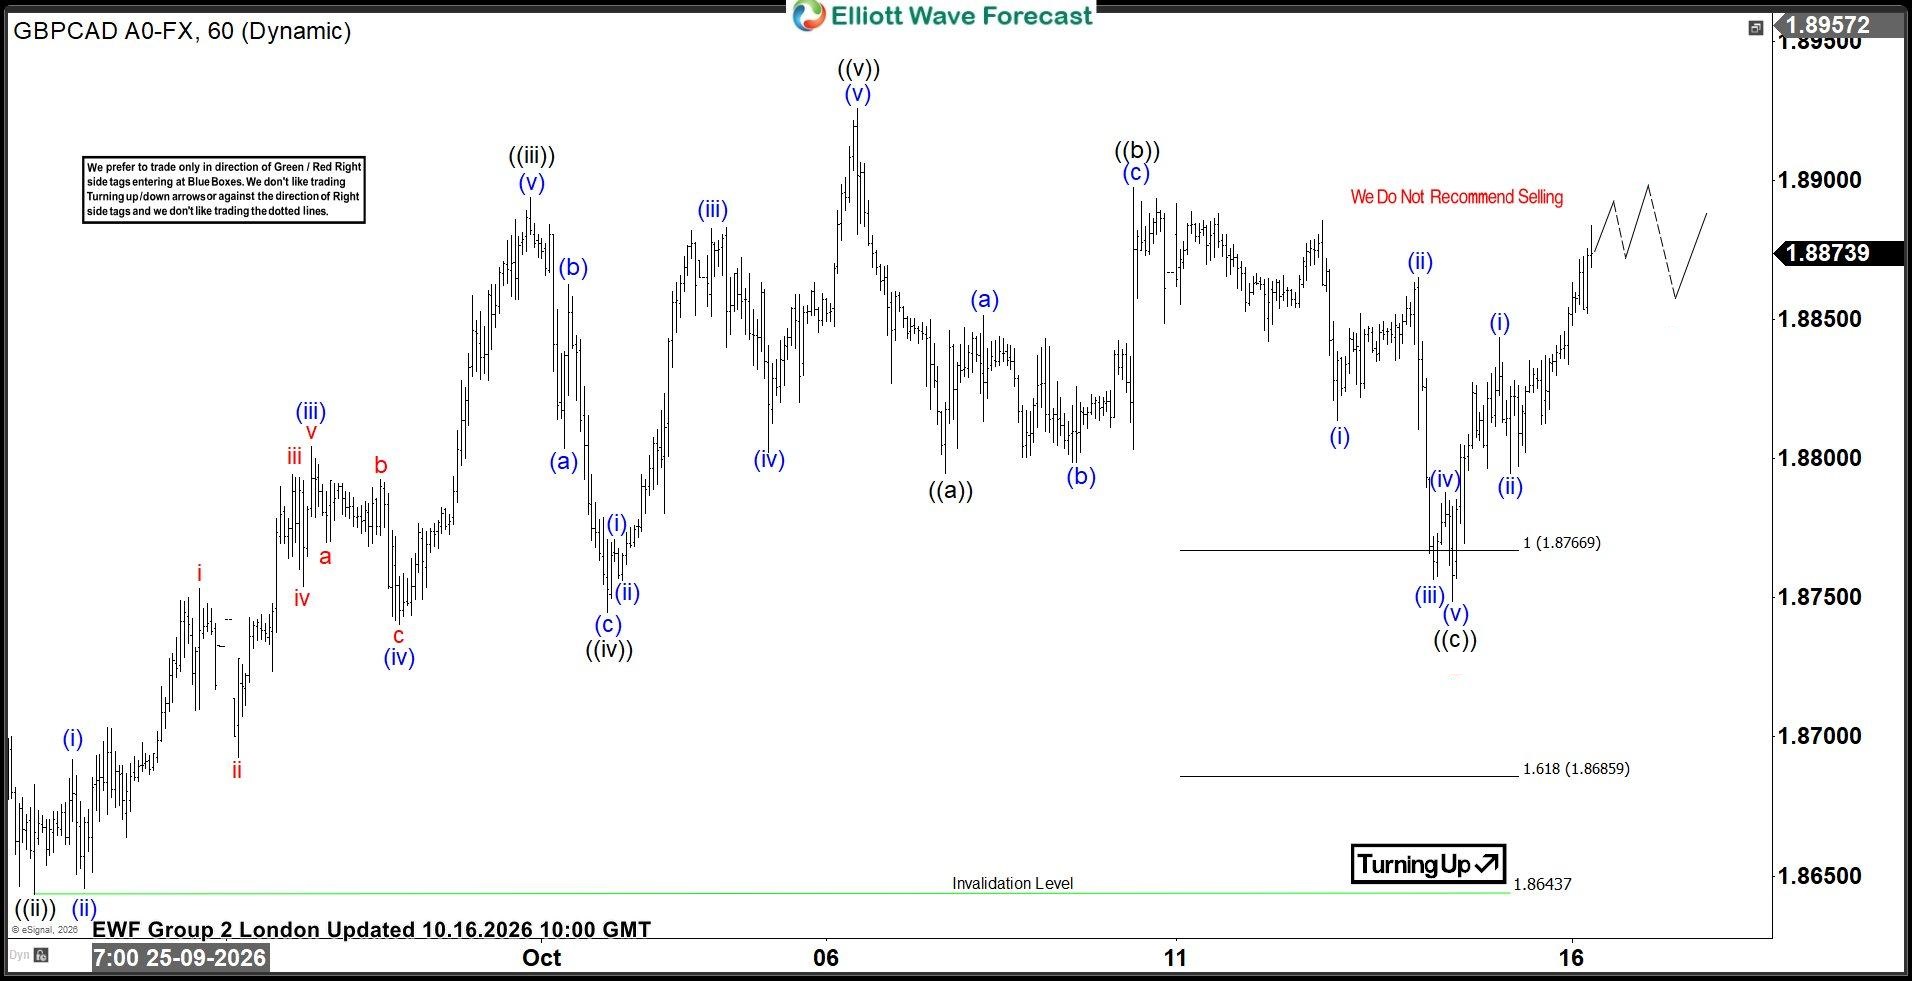
GBPCAD reached the Equal Legs zone at 1.8766–1.8685 and found buyers as expected. The pair delivered a solid reaction from the buying zone, with the corrective cycle completing at 1.8749. low and triggering a bounce.
Note: some labels have been removed from the chart in order to protect clients’ privileges.
Keep in mind that the market is dynamic and the presented view could have changed in the meantime. You can check the most recent charts with target levels in the membership area of the site. Best instruments to trade are those having incomplete bullish or bearish swing sequences.



Comments
Log in or sign up to join the conversation.