


A very strange post-meeting reaction from the market following Wednesday’s Fed meeting. The front end of the Treasury curve rallied sharply, with September rate hike expectations largely priced out of the swaps market. At the same time, the long end of the curve sold off aggressively. The spread between the 30-year Treasury yield and the 3-month Treasury bill widened by roughly 20 basis points on the day to 1.43%—a massive steepening move.
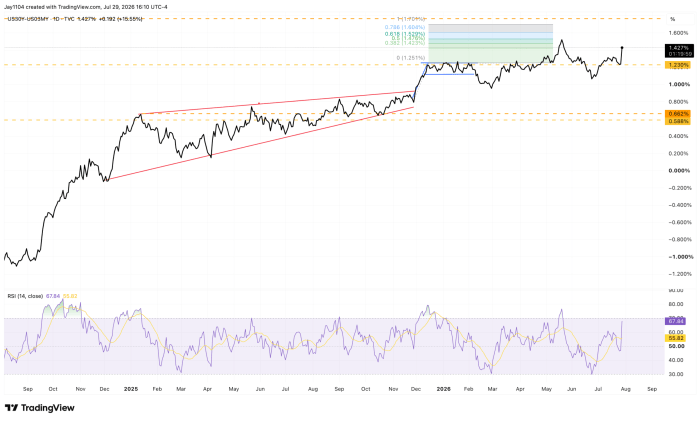
The interesting takeaway from today’s meeting is that the long end of the Treasury curve clearly got the message: the Fed is not going to stand in its way. Warsh acknowledged that both nominal and real yields have risen sharply since the June meeting, suggesting the Fed is watching the market and recognizing that financial conditions have already tightened significantly.
That is important because it allows the Fed to avoid raising the policy rate further. In effect, the market is doing the tightening for the Fed, and that is ultimately what matters. If the Fed is no longer relying on forward guidance and is instead allowing the market to dictate the narrative, then long-term interest rates can adjust to levels that appropriately compensate investors for inflation while allowing the yield curve to steepen naturally.
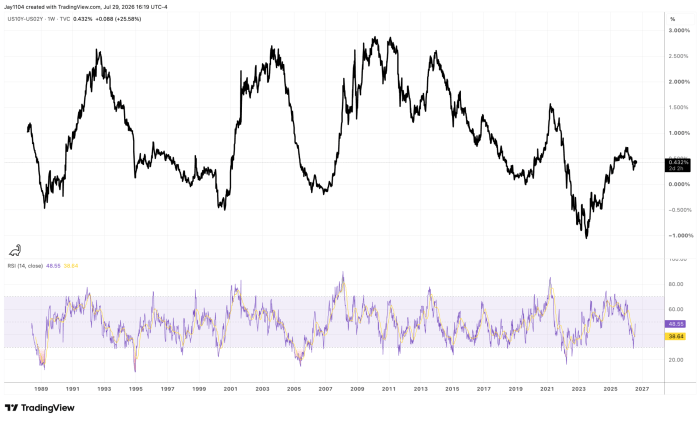
The yield curve remains historically flat, and that has been one of the reasons Powell and his colleagues struggled to bring inflation back to target. Long-term interest rates were never allowed to rise sufficiently relative to short-term rates, preventing the yield curve from steepening in a way that would have produced more restrictive financial conditions.
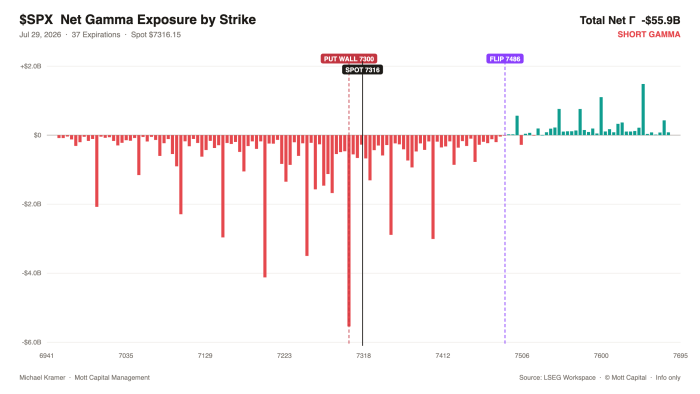
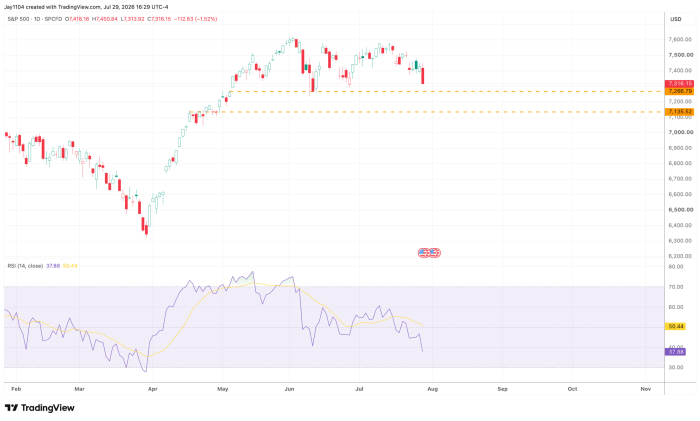
In the meantime, the S&P 500 (SPY) has entered the danger zone, closing at 7,315. The options put wall sits at 7,300, a level that could provide support if it holds. That is where put holders may choose to monetize their positions and unwind hedges, potentially helping to stabilize the market. However, a break of support does open the gates to significantly lower levels.
The market has also moved into negative gamma, meaning market maker hedging flows become directional and can amplify price swings. As a result, volatility is likely to increase, with market moves becoming larger in either direction.
Below that, technical support shows around 7,250 and 7,130.



Comments
Log in or sign up to join the conversation.