
The real return on long-term government bonds has dropped steadily over the last 30 years, falling from values around 4% to something closer to zero or even negative for many countries today. What accounts for this remarkable development, and what are the prospects for this situation to continue?
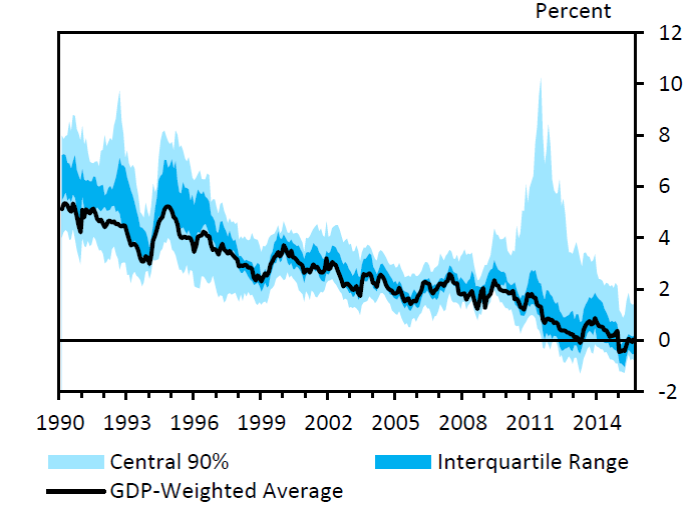
Range across advanced economies is estimated real yield on long-term government bonds. Source: Rachel and Smith (2015).
Bank of England economists Lukasz Rachel and Thomas Smith have a very interesting paper in which they propose answers to these questions. Their basic idea is to think of world capital markets as an integrated whole in which the world real interest rate is the value that equates global saving to global investment. Both saving and investment would be expected to grow with world GDP, so the authors describe these schedules relative to GDP. A fall in the real interest rate could result from a downward shift of one or both of these schedules.
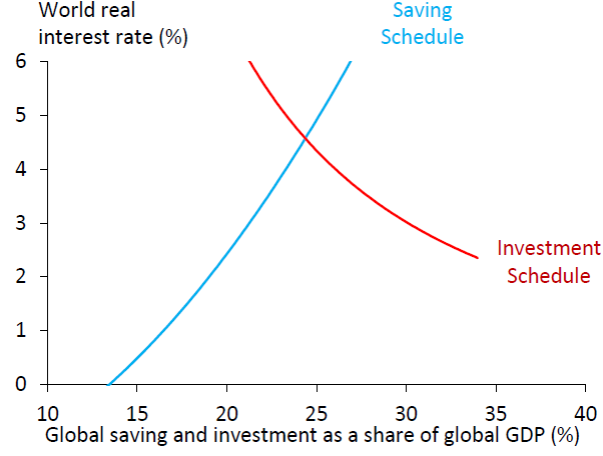
Vertical axis: world real interest rate. Horizontal axis: world investment or saving as a percent of world GDP. Source: Rachel and Smith (2015).
Demographic changes are one reason we might see a downward shift in the saving schedule. It is a very well-established observation across different countries and over time that people aged 30-60 tend to save a higher fraction of their income than do the very young or very old.
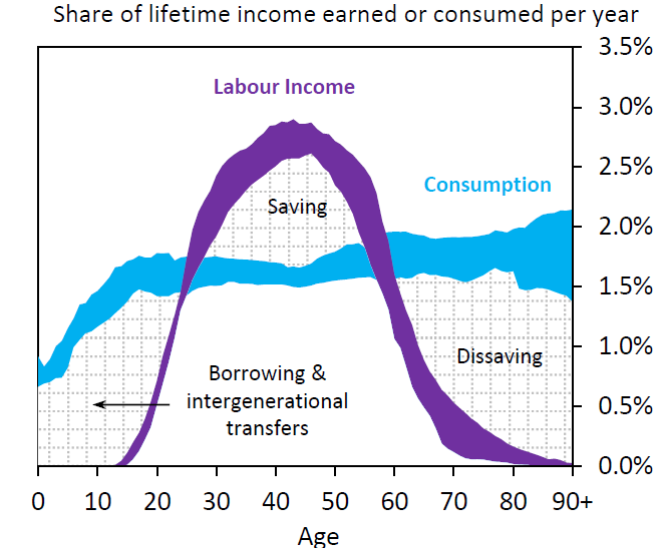
25th and 75th percentiles of the distribution across 23 advanced and emerging economics in percent of lifetime income earned each year (in purple) and percent of lifetime income consumed each year (in blue). Source: Rachel and Smith (2015).
We’ve seen a steady decrease worldwide in the fraction of the population under age 20 or over 65. Although the aging population is one well-known factor that would bring this fraction up, the fact that there are fewer young people dominates the ratio and explains why it has continued to fall. Given the observed relation between age and saving rates at the individual household level, Rachel and Smith calculate that this factor would result in a downward shift of the global savings schedule by about 90 basis points since 1980, though they acknowledge that there is substantial uncertainty about this and the other magnitudes estimated in the paper.
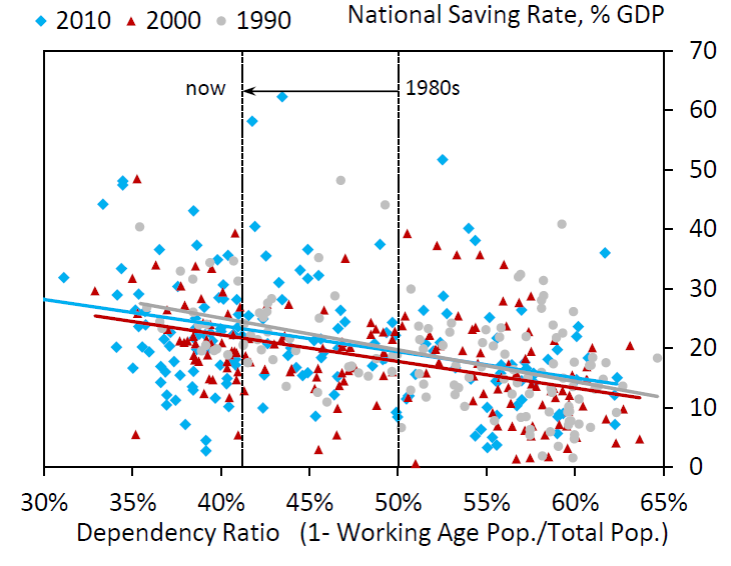
Gray circles represent average values for individual countries over 1990-1999 with saving as a percent of GDP on the vertical axis and the percentage of the population below 20 or over 65 on the horizontal axis. Red triangles are data 2000-2009 and blue diamonds the most recent data. Source: Rachel and Smith (2015).
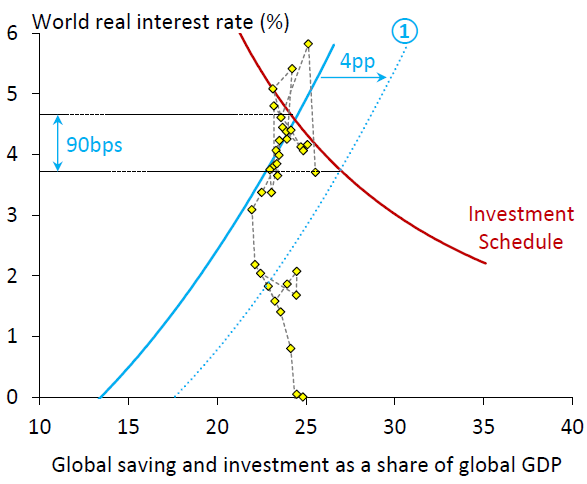
Change in global saving schedule predicted on the basis of changes in population age. Yellow diamonds correspond to observed values for saving rates and real interest rates for individual years. Source: Rachel and Smith (2015).
Another important change is growing income inequality. Anywhere in the world we observe that higher-income households spend a lower fraction of their income than poorer households. As the share of higher-income households has gone up, that would lead us to predict an additional 45-basis-point shift down in the world saving schedule.
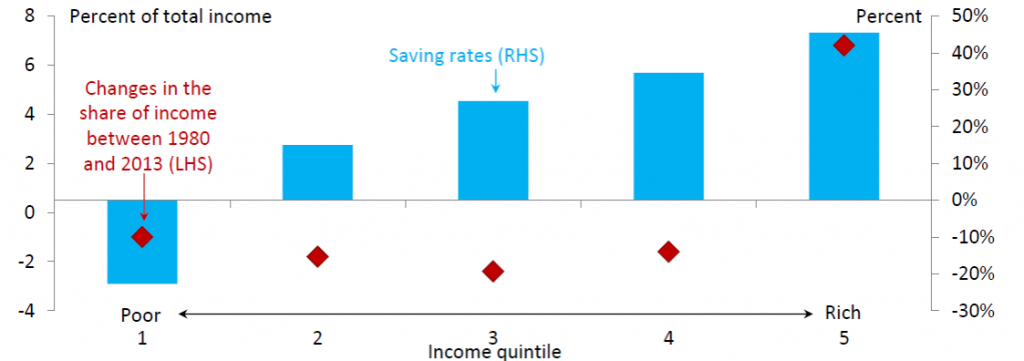
Blue rectangles: average saving rates (left axis) as a function of income quintile. Red diamonds: change in the share of income for that quintile between 1980 and 2013 (right axis). Source: Rachel and Smith (2015).
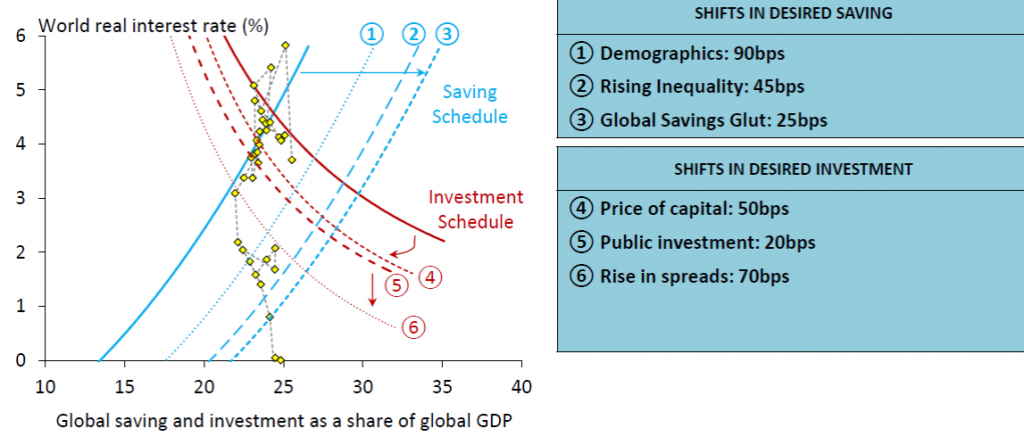
A final factor shifting the saving schedule down has been an apparent increase in desired savings rates on the part of emerging economies and the oil-producing countries, a development that Bernanke (2005) referred to as the “global saving glut”. Rachel and Smith estimate that this could have shifted the global saving schedule down an additional 25 basis points.
If the only changes had been these three developments bringing the saving schedule down, the result would be a movement down and to the right along a fixed investment schedule; interest rates would have dropped by less than 90 + 45 + 25 = 160 bp, and we would have seen an increase in global saving rates. The fact that the latter did not happen might then be attributed to separate factors shifting the investment schedule down. Rachel and Smith identify one of these factors to be a decrease in the relative price of investment goods. This allows firms to acquire productive capital with a lower fraction of GDP devoted to investment. The authors calculate that this might have shifted the investment schedule down by 50 basis points. In addition, there has been a decline in the fraction of world income devoted to public investment, which they think led to an additional 20-bp shift down in the investment schedule. Finally there has been an increased demand for government debt relative to productive capital, which has meant an additional 70-bp downward shift in the investment schedule as drawn here (with the real interest rate on government debt on the vertical axis). Putting all these factors together, Rachel and Smith can account for most of the decline in real yields in the face of little net increase in saving or investment.
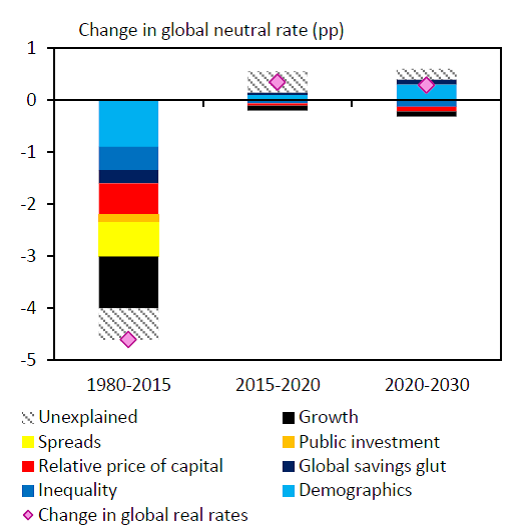
If this is the correct analysis, what does it imply for what we can expect in the future? The paper concludes:
most of these forces look set to persist and some may even build further. This suggests that the global neutral rate may remain low and perhaps settle at (or slightly below) 1% in the medium to long run. If true, this will have widespread implications for policymakers– not least in how to manage the business cycle if monetary policy is frequently constrained by the zero lower bound.
Comments
Log in or sign up to join the conversation.