

Hello everyone. In today’s article, we will look at the past performance of the 1 Hour Elliott Wave chart of Exxon Mobil Corp (XOM). The rally from 7.17.2022 low unfolded as a 5 wave impulse. So, we expected the pullback to unfold in 3 swings and find buyers again. We will explain the structure & forecast below:
$XOM 1H Elliott Wave Chart 8.8.2023:
(Click on image to enlarge)
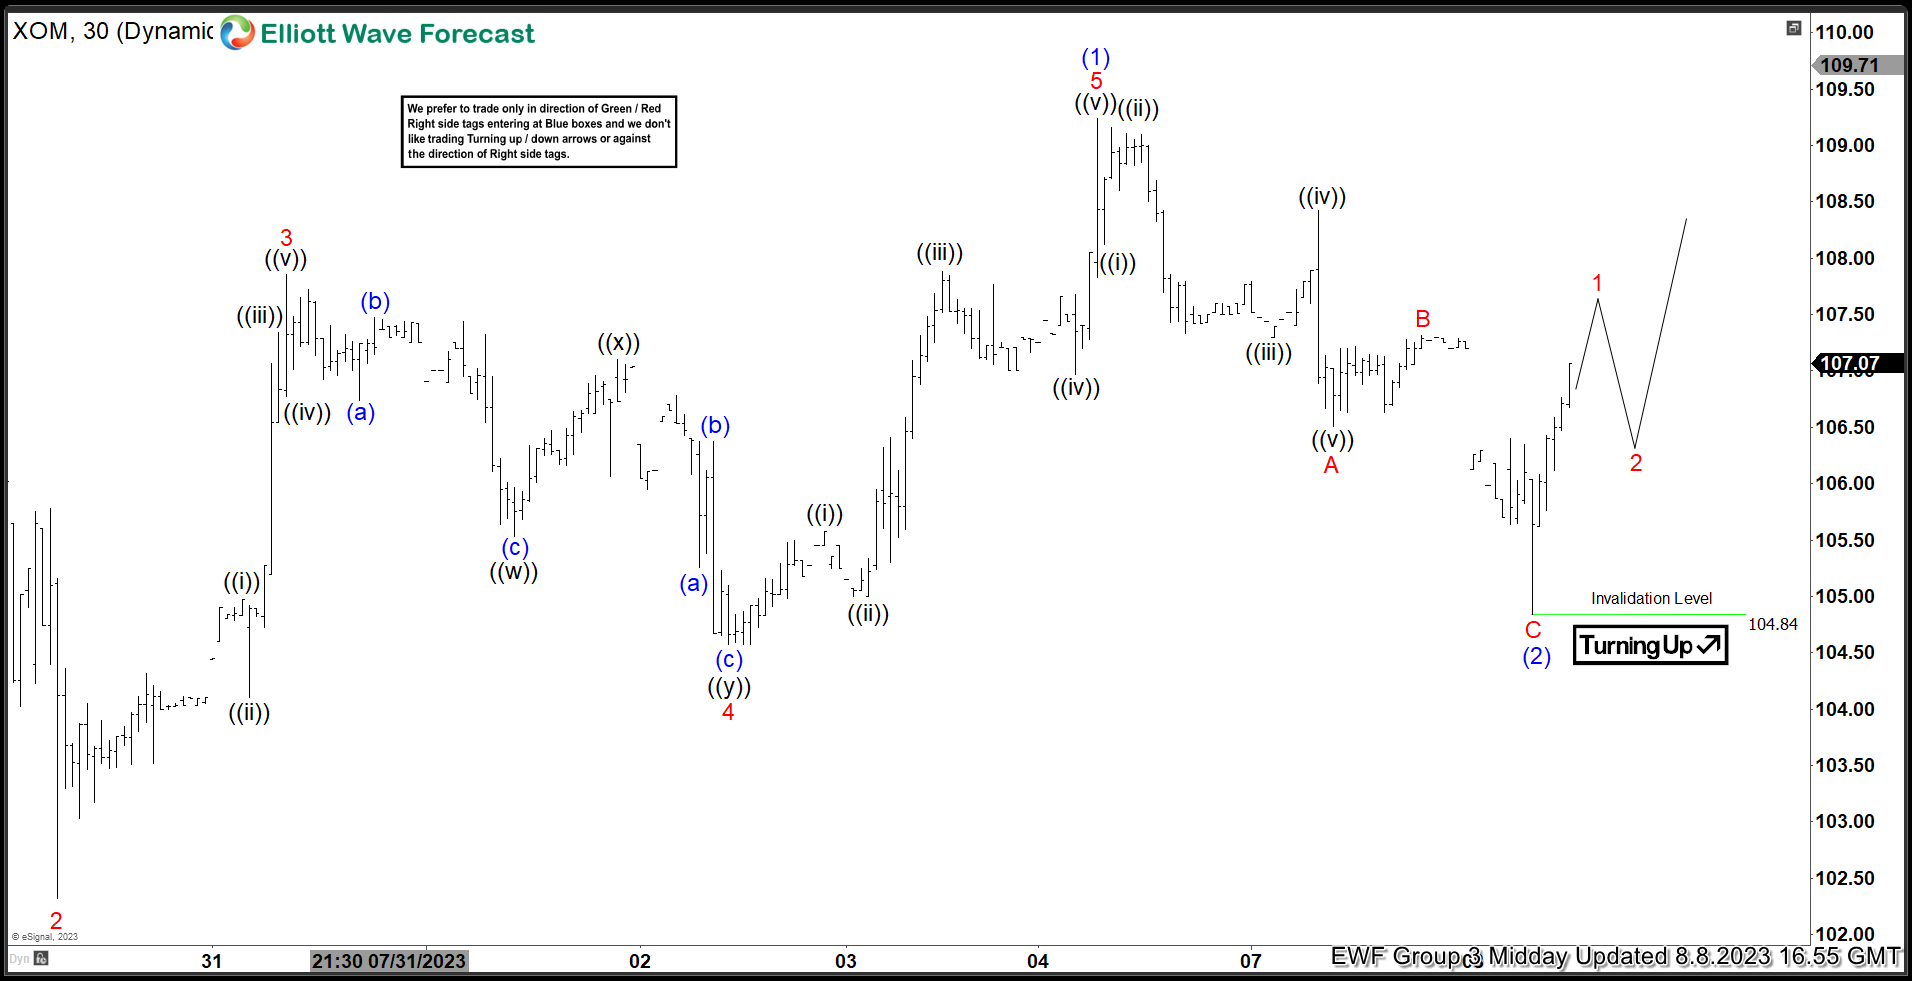
Here is the 1H Elliott Wave count from 8.08.2023. The rally from 7.17.2023 peaked at blue (1) and started a pullback to correct it. We expected the pullback to have found a bottom after 3 swings lower at $104.84.
$XOM 1H Elliott Wave Chart 8.11.2023:
(Click on image to enlarge)
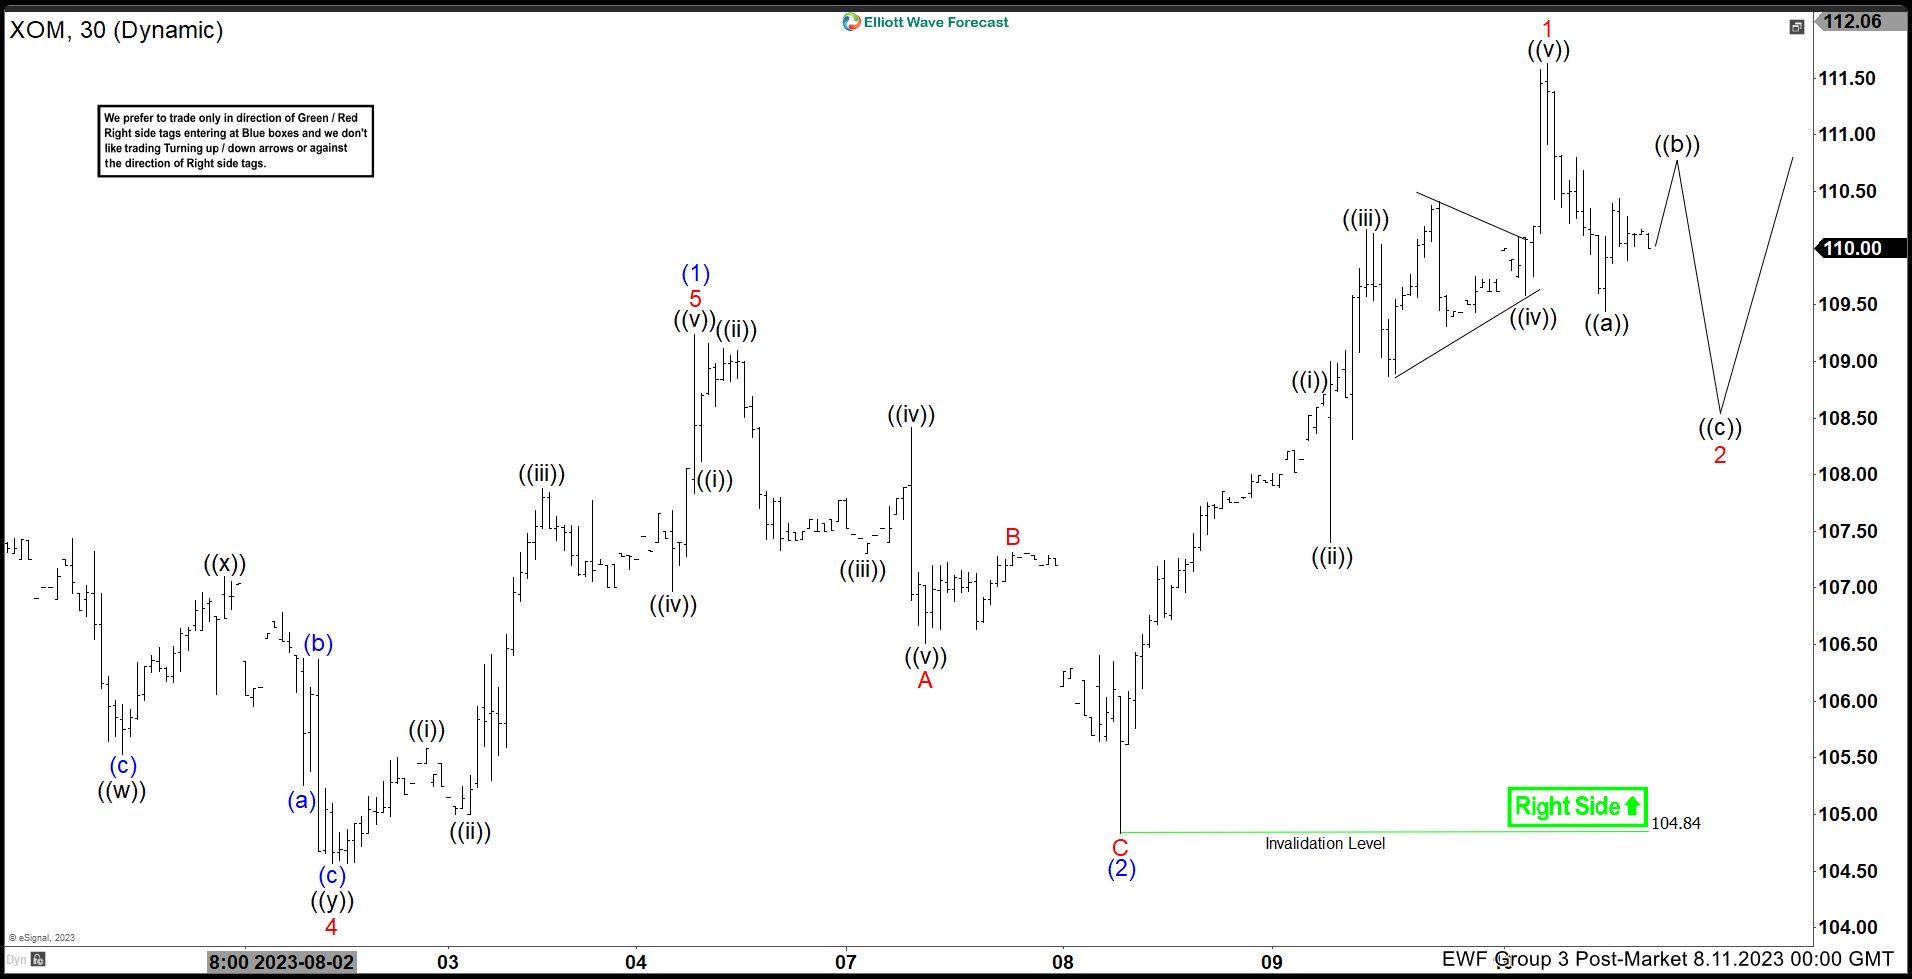
Here is the 1H update from 8.11.2023 showing the bounce taking place as expected. The stock has reacted higher after doing 3 swings lower and broke above the blue (1) peak creating a bullish sequence. We expect the stock to print a new high for the year and reach $124 – 132 before a pullback can happen.
More By This Author:
Elliott Wave Shows Home Depot (HD) Crash Is Still On The Cards
Walmart Outperform Market Expectations
Netflix Looking For Double Correction



Comments
Log in or sign up to join the conversation.